South Bay Homes – Fewer Sales, Higher Prices

In the first quarter of 2021 buyers and sellers were taking advantage of the artificially low interest rates. Sales were robust and the demand pushed prices up along with the increase in sales volume. By first quarter 2022 sales volume was waning, but sellers were still attached to the higher prices so we saw sales dropping off dramatically. The first three months of 2023 gave us even deeper cuts in the number of South Bay homes sold and brought some corresponding declines in median prices. Today, looking at the South Bay market for the first quarter of 2024, prices are still “sticky” with sellers hoping to hang onto the gains from the Covid years.

It’s not working real well. January gave sellers hope with a strong growth in sales volume and modest increases in median price. February showed returning median price increases and buyers backing off again in response. March is back to the drawing boards as buyers have balked at the price increases in the face of continuing elevated interest rates.

This is coupled with news trickling out of the Federal Reserve Board about how mortgage interest rates are probably not going to see the three rate decreases predicted at the beginning of the year. The latest announcement confirmed that if rate decreases come at all, it won’t be until late in the year and it won’t be significant.

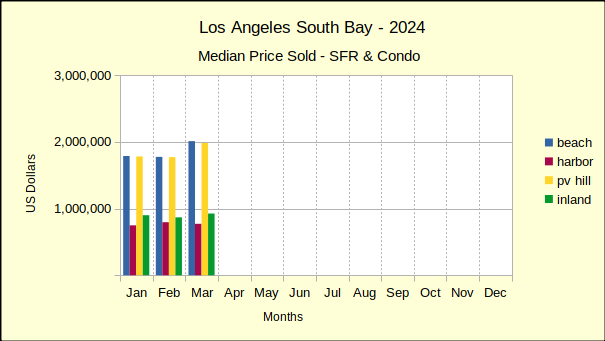
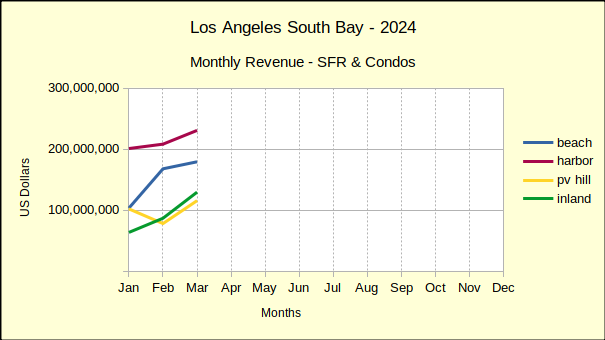
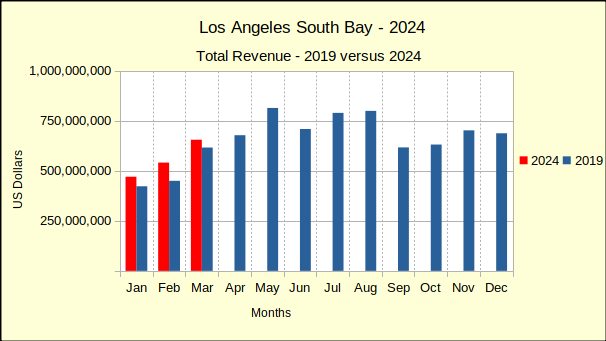
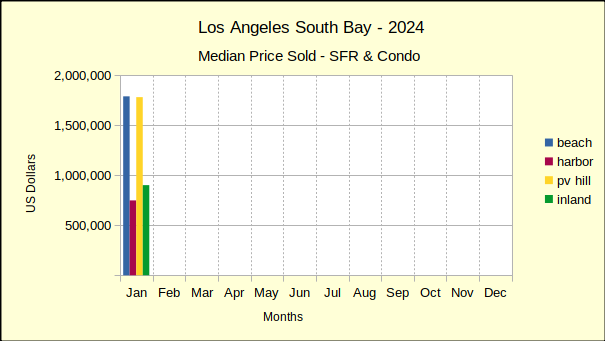
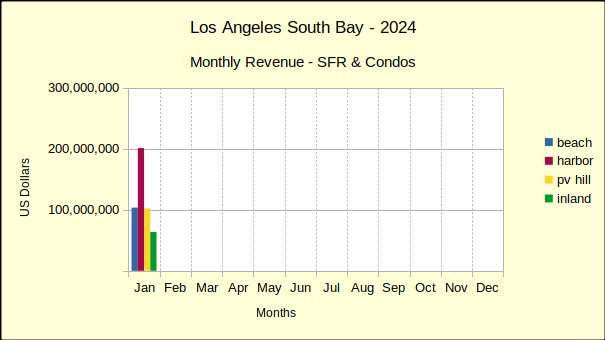
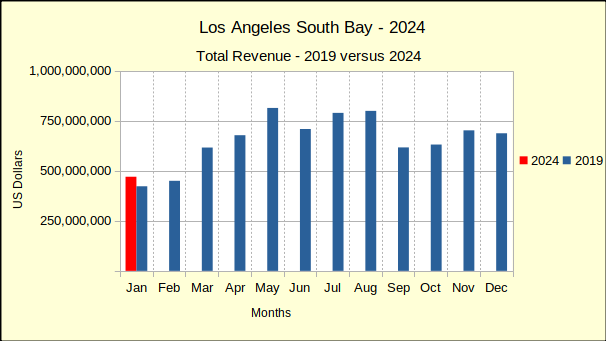
To gain perspective on the impact to the real estate market, it must be noted that the number of South Bay homes sold during the first quarter of 2024 is nearly identical to last year, and is still 19% lower than the first quarter of 2019, the last year of normal business before the pandemic. At the same time the median price of those homes is up almost 10% over last year and is 40% higher than it was in 2019.

Somehow a 40% increase in cost within five years, with a negative demand, seems to be a violation of general economic principles. It appears the post-pandemic adjustment back to normality has digressed somewhere along the path. Of course, all this has been further impacted by the fact 2024 is a presidential election year, and simultaneously the world is in extreme turmoil both economically and physically.

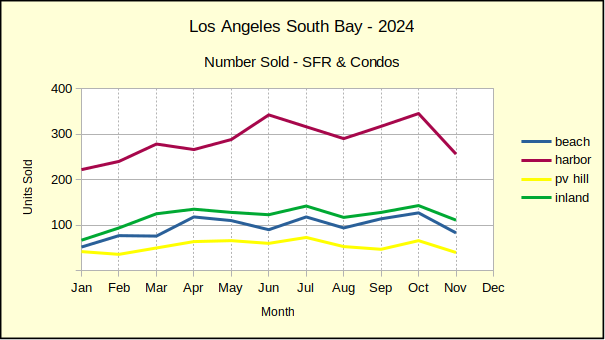
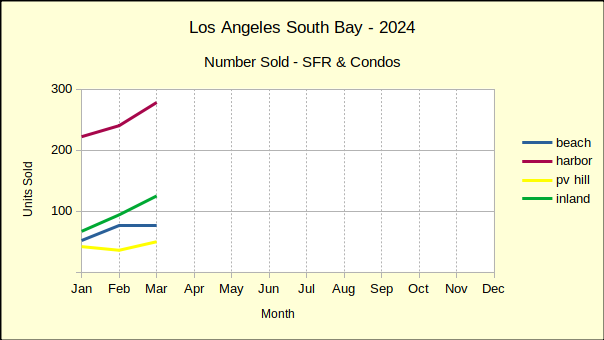
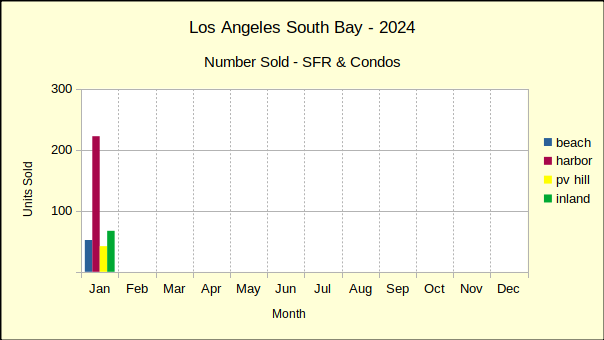
Month by month performance has been unusually erratic for quite some time. So far this year the comparison of this month to the same month last year is the most stable view of the real estate market. According to that view, the number of homes sold has gradually slid into negative territory. January kicked off the year with a blanket increase in the sales volume. February flipped that showing for about half the South Bay. which slid below the sales of last February. March has furthered that negative sales volume to all areas of the South Bay.

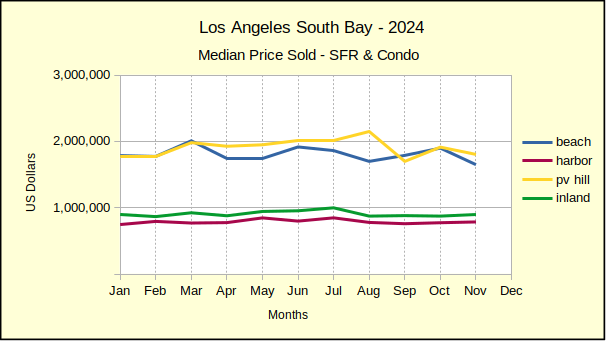
Median prices are managing to stay above those of 2023. With sales down across the area and mortgage interest rates stubbornly increasing, that may be changing soon.

Beach: Home Sales Erratic

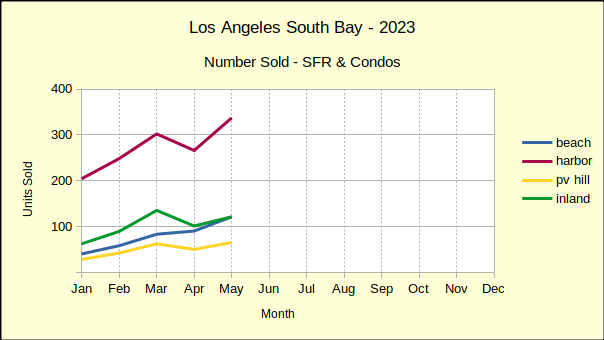
The Beach cities truly exemplified the erratic nature of month over month statistics during the first quarter. Compared to the prior month, sales in January were down 46%, in February up 48% and in March down 1%. Using the same metrics, monthly median prices were up 13%, down 1% and up 13%.

Looking at the same three months in a year over year method, the statistical movement is much less dramatic. Compared to the same month last year, January sales volume was up 30%, February up 33% and in a surprise drop, March was down 8%. By the same token, median prices were up 7%, up 29% and up 16%.

Disconcertingly, it’s been two years since the pandemic ended and the market is still seeing double digit movement monthly in both volume and pricing. This lack of stability results from several different influences on the real estate market. Among them the continued increase in mortgage interest rates, a corresponding relaxation of qualification requirements by lenders, a public perception of good economic conditions and a continued shortage of homes on the market.

Year to date sales volume for homes at the Beach has increased 13% while median prices have risen by 7% over 2023. Compared to 2019, sales are off by 35% with median prices 43% higher.

Harbor: Up, Then Down, Then Up

Month to month activity for the first quarter in the Harbor area has followed an equally irrational pattern to that of the Beach. January saw sales and prices drop by 13% and 4% respectively. Then February brought increases in both numbers, volume going up 8% and the median price by 6%. March came in mixed with sales volume up 16% while the median slipped by 3%. Annually, homes in the Harbor area started the year on a positive note with 9% growth in number of homes sold and an accompanying 7% growth in median price. February saw sales decline 3% with an increase in median price of 18%. Sales volume continued to fall in March, decreasing by 8%, albeit with a 4% increase in median price.

Year to date for the first quarter shows the number of homes sold declined by 2%, while the median price increased by 10%. Compared to 2019, sales are off by 16% with median prices 43% higher.

Hill: Sales and Prices Up; Sorta

After two months of negative sales volume and falling median prices, home sales on the Hill perked up in March. Volume was up 39% with 50 properties sold and median prices took a 12% jump to $1.982M. As mentioned in the past, properties on the Palos Verdes peninsula, much like those in the Beach cities, represent a smaller segment of the marketplace and often one or two outsize transactions will create a major shift in the statistics.

Of course, that “perkiness” is relative. While the number of homes sold was 39% higher than February, it was still 19% lower than March of 2023 and 25% below March of 2019, the last year prior to the upsets of the corona virus pandemic.

The 19% drop in sales was accompanied by a 14% increase in median price, a contradiction seen around the South Bay and generally across the State. The typically accepted explanation is that many home owners took advantage of the low mortgage interest rates offered during the pandemic. Those people are now unwilling to take on a new mortgage with an interest rate two to three times higher than they are currently paying. This is leaving a much smaller selection of available homes and has created an inventory shortage which encourages competitive bidding among the few buyers active in the market.

The first quarter of the year brought a 3% decline in homes sold on the Hill and an 8% increase in median price. Compared to the first three months of 2019, sales are currently off by 11% and the median is up 36%.

Inland: One Good March

The number of homes sold in the Inland area for March jumped by 33% to 125 closed escrows. Median prices increased a more modest 7% to $925K. Like the Harbor area, there is a comparatively large number homes in the Inland area and they offer a diverse range of prices. As an example, the low sale for this March was $371K while the high was $2.525M. Mathematics is a great tool for analyzing trends in real estate, but if one is planning to buy or sell in this environment, you should call a professional rather than simply applying these statistics.

Compared to the same month last year, March sales volume was down 7%, while the median price was up 11%. Year to date, the sales volume for the Inland area was unchanged, and the median price was up 8%. Similarly, comparing to 2019, sales were down 12% and prices up 40%

As discussed earlier, there’s a tendency for buyer resistance to the combination of higher prices and higher interest rates. Three months into the year, that resistance seems to be growing. Since the most recent Federal Reserve announcement, mortgage interest rates have climbed about .375% (3/8ths of a point). Looking at the statistical trend in conjunction with the increasing interest rate, we anticipate continued slippage in volume and more declines in median price throughout the South Bay.

Beach=Manhattan Beach, Hermosa Beach, Redondo Beach, El Segundo
Harbor=Carson, Long Beach, San Pedro, Wilmington, Harbor City
PV Hill=Palos Verdes Estates, Rancho Palos Verdes, Rolling Hills, Rolling Hills Estates
Inland=Torrance, Lomita, Gardena

Photo of the San Pedro coast by Marius Christensen on Unsplash
January Home Sales Down, Prices Up

Across the Los Angeles South Bay the number of homes sold in January was down compared to December—way down. For the same time period median prices are mixed with most sales either flat or down.

Looking at sales volume in January versus January of last year, shows big increases in activity. However, that serves more to show how slow the real estate market was at the beginning of 2023, than how good it is today. Median prices were likewise up for most areas when compared to the same month last year.

From a historical perspective, looking back at 2019, still the most recent “normal” business year for real estate, we see sales volume overall remains 21% below that benchmark. Median prices, which shot up during the pandemic have stubbornly stayed up. As of January, median prices range from 25-30% above the 2% inflation factor the Federal Reserve targets.

The combination of inflated prices and mortgage interest rates testing the 7% level has created a stagnant market place. Typically a presidential election year would bring rosy news about a growing economy and low interest rates. At this point there’s only one month of data, not enough to make any forecasts, but 2024 is off to a slow start.

Beach: Sales Off 46%

Month to month sales volume in the Beach cities collapsed by 46% in January. After back to back increases in the number of homes sold for November and December, the huge drop was unexpected. Juxtaposed against the 13% increase in median price, it demonstrates the current market dynamic.

The only actual buyers are people who have no choice but to move, despite the low inventory and high interest rates. At the same time, most sellers are stalling because they don’t want to be sitting on the market for weeks. And, because most sellers are also buyers, they’re waiting for a better market with more homes available and lower interest rates for their replacement purchase. As a result, the number of available homes listed on the MLS is further depressed.

This has brought about a rare phenomenon, the “off-market” sale. Both buyers and sellers are actively looking for deals that can be consummated without the competitive environment of the Multiple Listing Service (MLS). Buyers love the fact there are no bidding wars. Sellers are glad to sell at asking price without endless open houses and dozens of showings. The properties usually end up on the MLS as history, but not as competition. How long this trend will last depends on the economy over the next few months.

The market at the Beach has clearly improved since last year. Sales from January of 2024 have climbed 30% compared to January of 2023. At the same time, median price has moved up 7%. Of course, as mentioned earlier, last January was far from a good market in real estate.

Given the turmoil of recent years, one is compelled to look back at 2019, before the pandemic with it’s rock-bottom interest rates and sky-rocketing prices. Using that metric, January sales this year fell 34% below January of 2019. Median price this January was 43% higher than it was in January of 2019. Clearly “normal” is still a long way off.

Harbor: Sales Off 13%

Month to month statistics from the Harbor area demonstrate a truism. Pointing the way toward stability in the market, many of January’s home sales came with a reduced price. The median price dropped 4%, rather than increasing as it did in the Beach cities. Those price reductions appealed to buyers and the number of transactions increased considerably. Correspondingly, the sales volume only dropped 13% as opposed to a 46% drop at the Beach.

Harbor area sales for January 2024 ended with 9% more transactions than the same month lin 2023 in an unsurprising response to the market collapse of last winter. Also on the positive side, median prices for Harbor area homes increased by 7%.

Pre-pandemic residential sales for January 2024 was mixed in comparison to January of 2019. Sales volume was off, with 16% fewer homes sold in 2024. At the same time, median prices were up 44%.

Hill: Sales Off 16%

November and December of last year looked like a bad thing was turning good, and then January 2024 came along. Home sales on the Hill suffered less than at the Beach or Inland, but a 16% drop in sales volume in an already moribund market hurt. Median prices on the Hill hit that “sweet spot” with no change up or down.

Compared to January of 2023 the number of home sales on the Hill went stratospheric climbing 50% for the month. Of course, having read this far you know last winter was a low spot in the market. Combine that with the comparatively small number of sales on the Palos Verdes Peninsula and it’s easy to have outsize percentages. While sales volume was up 50%, median prices climbed a more modest 8%.

January 2024 versus January 2019 in home sales on the Hill showed an solid improvement. The number of homes sold increased by 27%, in contrast to falling sales in the Harbor and Beach areas. With the number of home sales up, a 37% increase in the median price is a welcome addition.

Inland: Sales Off 36%

Home sales in the Inland area closely followed those at the Beach in January. Similarly, the month ended with a calamitous 36% drop in the number of homes sold—down to 67 homes from over 100 in both November and December. Likewise, the median price came in with an 11% increase, slightly less than at the Beach. This shows the effect of “sticky prices” where a lot of sales don’t happen because the sellers are resistant to lower offers and buyers are balking at higher prices.

On a year over year basis, January 2024 showed 8% growth in the number of sales compared to last January. Median prices continued following the long downward slide of 2023 and dropped another 6%.

Comparing the Inland sales to 2019, the most recent stable year, the number of homes sold has dropped by 39% leaving a lot of room for recovery. The median price has climbed 40% over that five years, roughly 27% greater than the “ideal inflation” sought by the Federal Reserve.

Beach=Manhattan Beach, Hermosa Beach, Redondo Beach, El Segundo

Harbor=Carson, Long Beach, San Pedro, Wilmington, Harbor City

PV Hill=Palos Verdes Estates, Rancho Palos Verdes, Rolling Hills, Rolling Hills Estates

Inland=Torrance, Lomita, Gardena

Photo by T Narr on Unsplash
Palos Verdes Homes Top the South Bay Market

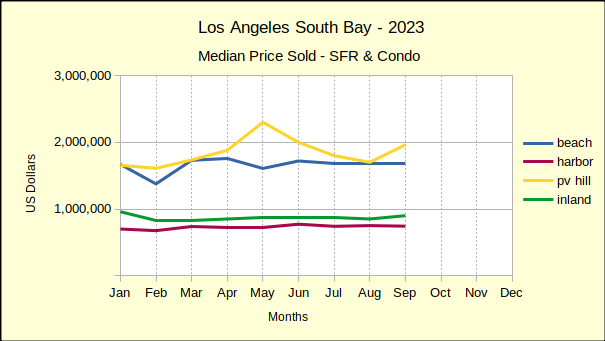
Home sales on the Palos Verdes Peninsula chalked up an impressive set of statistics in October. Comparing the October 2023 sales to October of last year showed a stunning 26% increase in sales volume beside an equally impressive 11% increase in median price. At the opposite end of the spectrum the Beach Cities October sales volume fell 19% from 2022, while the median price dropped 14%.

Elsewhere across the Los Angeles South Bay volume and prices were mixed with the general trend leaning toward decreased number of homes sold and prices struggling to stay level with last month while often slipping below.

Year To Date Sales Continue to Drop

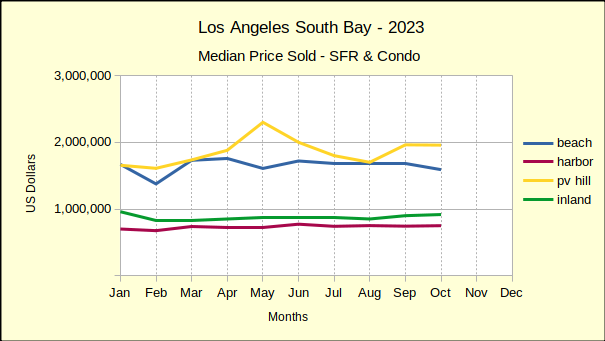
In between the highs and the lows real estate activity in the South Bay has been mixed for the months of August through October. While many commentators are cautiously hopeful, it must be noted that year to date comparisons continue to show significant declines in the number of homes sold, with an average drop of 18% from 2022 for the first 10 months of the year. Likewise, median prices are falling for the January through October time frame. For example, median prices on the Hill were up in October, but have fallen 4% year to date compared to last year. Similarly the Beach area median is down 3% and the Harbor area is off 2%.

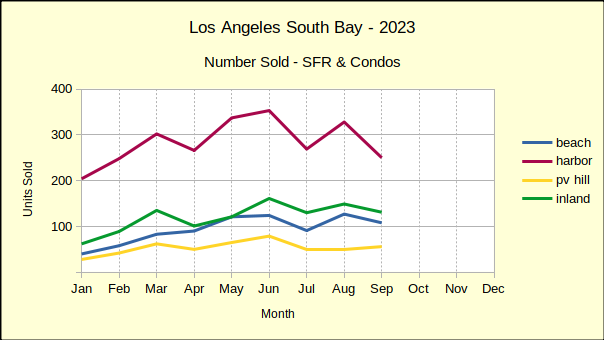
Sales volume is clearly down. By this time in 2022 sales were at 6700 units versus 5500 this year. Many buyers have been “priced out of the market” and many sellers are resisting the idea of “prices going backward.” The result has been a lot of deals not being made.

Year to date, the deals that have been consummated are still generally at median prices above last year, however the most recent three months have shown at least half of sold homes required price reductions to make the sale. With winter setting in, we expect continued reductions in both the volume of sales and in the prices of sold homes.

Home Sales at the Beach Hit a Wall

Throughout the year real estate in the Beach Cities has maintained spotty growth. Sometimes median prices improved, sometimes sales volume. But, October brought a wall of red ink for the Beach. Month over month sales volume plummeted by 27%, while the median price dropped 5% from September when it was flat at $1.7M.

Year over year transaction volume dropped 19% from September of 2022. The median price fell 14% for the same period.

Looking at the year to date statistics showed more declines with sales volume for the first 10 months of 2023 coming in 16% below that of 2022. At the same time, the median price was off by 3%.

In prior downturns the Beach area has been among the last to respond to market negativity and one of the first to recover. If the pattern repeats, sales at the Beach will continue to show predominately negative numbers for the late fall and winter months. Most chroniclers project a return to positive market conditions in late 2025 or early 2026 in general.

Harbor Volume and Prices Turn Upward

Home sales in the Harbor area moved from all negative last month to mostly positive this month. Sales volume on a monthly basis jumped from 24% down in September to a 7% increase in October. Similarly, the month to month median price went from -1% to +1% in October.

Annually, the number of homes sold in the Harbor area increased by 6%, a significant change from having fallen 26% in September. The median price came in at $750K, up by 7%.

That’s only the second time this year the Harbor area median price has come up into the positive range when compared to 2022. Overall, the year to date median sits at $739K, 2% below last year’s number of $756K. Sales volume for the Harbor is off 20% year to date. The number of homes sold for the first 10 months is 2824, compared to 3535 in 2022.

Palos Verdes Homes Star in October Sales

Home sales on the Hill came in at 63 homes sold with a median price of just under $2M. Month over month that represented a 13% growth in sales volume and no measurable change in the median price.

On an annual basis October sales were up 26% over the same month in 2022. This year’s median price was up by 11% over last October.

While these numbers reflect impressive growth it’s important to remember that the number of transactions on the Palos Verdes peninsula is quite small, which results in some dramatic percentile shifts. For example, the annual percentage of change in the median price so far this year has ranged from a low of -29% to a high of 17%. By comparison, the Harbor area where monthly transactions number in the hundreds, has an annual range from a low of -11% to a high of 7%.

On a year to date basis, the Hill showed a more common face with the January through October sales volume down by 20% from 2022. During the same time frame median prices fell by 4%.

Inland Area Sales Volume Down, Prices Up

In a surprising turn of events, the Inland area has shown an increased median price for both the monthly and for the annual sales figures. The median price came in at $917K this October, which was 2% above the September median. On an annual basis, the median was up by 7% over the $860K of October 2022.

With 116 units sold for the month of October this year, the sales volume was 11% lower than it was this September. The monthly decline was even greater than the drop of 9% for the year over year comparison to last October.

Year to date, the Inland area has outperformed the balance of the South Bay on median price and on sales volume. For January through October there is no discernible change to the median price from 2022 to 2023. In the same time frame the sales dropped by 14%, the smallest decline of the local areas.

Beach=Manhattan Beach, Hermosa Beach, Redondo Beach, El Segundo
Harbor=Carson, Long Beach, San Pedro, Wilmington, Harbor City
PV Hill=Palos Verdes Estates, Rancho Palos Verdes, Rolling Hills, Rolling Hills Estates
Inland=Torrance, Lomita, Gardena

Photo by Julianne Takes Photos on Unsplash
South Bay Real Estate Struggles to Stay Afloat

The summer selling period for real estate in the South Bay showed mixed results for August and September. July was down across the board, but both the volume of sales and the median price was able to rebound in some areas. Notably, the Beach Cities come out of the third quarter with median prices up by 2% over last August, and up by 3% over September of 2022. That growth wasn’t enough to make up for earlier this year when median prices were down by as much as 17% in year over year sales.

Year To Date Prices Down Across the South Bay

Comparing the first nine months of 2022 to the same period in 2023 shows median prices at the Beach down 2%, the Harbor down 2%, the Hill down 8% and the Inland area down 1%. Similarly, the number of homes sold dropped at the Beach by 15%, the Harbor by 22%, the Hill by 23% and the Inland area by 14%. On average across the South Bay sales volume was off by 20%.

To some extent this validates the supply versus demand theory. With interest rates above 7%, many potential sellers (who are simultaneously buyers elsewhere) have simply changed their plans. They’ll wait for interest rates to abate before trying to move. The California Association of Realtors reports that the number of homes sold across the State has fallen for 27 consecutive months. Locally, a couple of neighborhoods have shown year over year improvement a couple of times, but overall, the last time sales volume was positive across the South Bay was September of 2021, 24 months ago.

Because there are so few homes available for buyers in a must move situation, those buyers are forced to buy despite high interest rates and despite elevated prices. Mortgage interest rates are currently testing the 8% number, and are expected to stay there into 2024. Most forecasts expect the number of sales to drop even further, possibly offset by an increase in renters and a corresponding increase in rental prices.

Things don’t happen very fast in the real estate market. We mentioned earlier that sales have been declining here for 24 months already. But, prices are still up and interest rates are still climbing. Currently, we expect to see a shift in the pattern this winter. As time goes on, more and more sellers will surrender to the inevitable and lower their asking price. Coupled with an increasing number of short sales and foreclosures, that will create the key metric the Federal Reserve is looking for to quell inflation. Most pundits are suggesting 2025-2026 for the bottom of the current down-trend and the beginning of a recovery.

A Home or a House?

Are you buying a home? Are you looking for a neighborhood that matches your personality? Are you looking for schools for your children? And nearby businesses for your family needs? That’s a home. If you’re looking at the appreciation rate for the zip code and how much you can leverage, that’s a house. The difference becomes important when the real estate market is rocky. When you’re buying a home, you’re looking at time over generations. Percentages on a loan mean little then because the property can be refinanced many times before it belongs to the family.

Are you looking for a house? Are you measuring the appreciation and the cost to income ratio? Are you looking for a distress sale and a rock-bottom price. Now is the time to put your cash away. Make no mistake—cash will be required! That’s not to say you can’t finance part of your investment, but count on having “skin in the game.” Your lender will require it. Over the next twelve months, accumulate as much cash as possible, and make your broker your best friend. You want a constant finger on where good deals are happening and you want to be one of the first on the scene. The “bottom of the market” is a hypothetical point. Your best deal can be anywhere in the area and any time in the downturn. It just has to meet your investment requirements!

Beach Cities Holding Strong Over 2022

The median price of homes sold in the Beach Cities was flat for August and September, following a 2% drop in July. Coming in at just under $1.7M the month over month price has been mostly down for the first three quarters of the year. Following a similar pattern, the month to month sales volume has fallen after a strong start in early spring.

In year to year comparison, both August and September have shown a modest improvement over the same months last year. Median prices were up 2% in August and 3% in September. This improvement comes on the tail of four straight month of declining median prices. Supporting the growth in median price, sales volume was up 23% in August and 20% in September. The positive numbers at the Beach are a welcome respite following 21 months of falling volume.

Looking at year to date 2023 versus 2022, median prices are down 2% and sales volume is down 15%.

Harbor Volume and Prices Slipping

September found home sales in the Harbor area fell in all measures. On a month to month basis, sales volume dropped 24%. At the same time, median prices fell 1% below the August median.

Year over year showed the number of homes sold down by 26% and the median price down by 3% from September of last year.

Year to date for the first three quarters of 2023 sales volume was off by 22% while median prices dropped 2%.

This is a pattern we expect to see repeated again and again during the coming two years. First the sales volume declines steeply, and median prices begin a downward trend. Then as the sales volume continues to decline, sellers begin to panic and the few active buyers tighten up on the terms of their offers. The cycle typically continues until falling commodity prices and weak employment numbers convince the Federal Reserve inflation is under control. Then it will start lowering the interest rate and allow markets to float free again.

Palos Verdes Transactions Volatile

The PV Peninsula came through September with positive numbers for the month, though the annual and year to date numbers suffered some slippage. Sales volume for September came in 14% above August and the median price was a respectable 15% above the prior month.

Compared to September of last year, home sales on the Hill fell by 7%. That decline was countered by a 5% increase in median price over the same month in 2022.

Like the rest of the South Bay, PV suffered downturns in the year to date statistics. The first three quarters of 2023 ended with a 23% downward slide in home sales volume, accompanied by an 8% fall in median price.

Inland Area Sales Volume Mixed, Prices Up

The Inland area performed surprisingly well in September. Home sales in the Inland area typically mirror those in the Harbor area. Last month brought a surprise when the median price climbed 6% above August. This positive note came despite a 12% drop in sales volume.

September of 2023 compared to September of 2022 brought even more surprise with a 5% increase in median price as well as a 17% jump in sales volume.

Year to date activity for the first nine months of 2023 compared to the same time frame in 2022 fell in line with the rest of the South Bay, Sales volume fell by 14% and median price by 1%.

Beach=Manhattan Beach, Hermosa Beach, Redondo Beach, El Segundo
Harbor=Carson, Long Beach, San Pedro, Wilmington, Harbor City
PV Hill=Palos Verdes Estates, Rancho Palos Verdes, Rolling Hills, Rolling Hills Estates
Inland=Torrance, Lomita, Gardena

Photo by Oliver Cole on Unsplash

Price Declines Forecast Through 2025

Median Home Prices Falling

Year to date through July, the gross revenue for South Bay is a mere 3% above that of 2019. At the same time, sales volume, the number of homes sold, is 23% below the sales of 2019. By most standards, 2019 was the pinnacle of real estate business prior to the turbulent years of the Covid pandemic.

Many sources compare current business to that of the pandemic years, partially because it’s easy and partially because the “numbers look better.“ Undeniably, the statistics do look more favorable, however, this analysis takes comparisons beyond the normal “last month” and “same month last year” to include 2023 versus 2019. This allows our readers to see 2023 in a historical context and to more readily recognize the unfolding recession.

While median prices are still above those of 2019 right now, we project the median prices will also drop below the 2019 level before this recession ends. On a month to month basis, prices are falling approximately half the time. On a year to year basis, 2023 prices have dropped below 2022 medians 82% of the time. Median prices for June and July of 2023 fell below 2022 in all four areas both months. Buyers and sellers should anticipate the bottom of the recession in late 2024, or possibly 2025. Normal growth should return in 2026.

The July report from the Federal Reserve Bank (Fed) notes that inflation is expected to continue above the target of 2% through 2025. Accordingly, the Fed efforts to “restrain” the economy (meaning increase interest rates) will continue into 2025. The report indicates that while housing costs are slowing, they continue to increase at inflationary levels, necessitating further reduction.

In the meantime, buyers who are financially able should plan to acquire desirable properties at substantially better prices than will be available after recovery begins. Sellers who anticipate a need to sell before the economic turn-around, should look toward selling sooner rather than later, to minimize the impact of the down-trending market.

Beach Cities Summer Market Fizzles

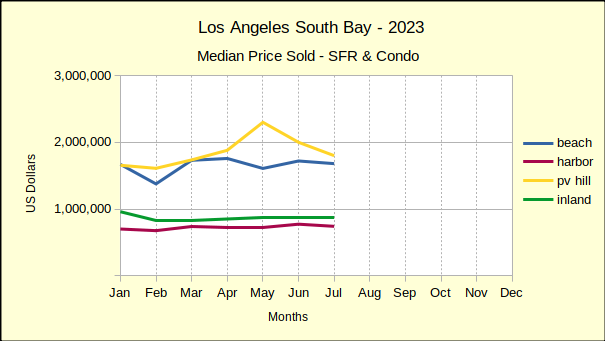
From June to July the number of homes sold in the Beach Cities fell 27% and those sold for a median price of 2% less. Some of the decline in sales is attributable to fewer homes available, as sellers hold properties off the market in hopes of improving conditions. Even more is a result of buyers who have lost significant purchasing power as mortgage interest rates have rocketed to over 7%.

Compared to July of 2022, the number of homes sold this July dropped 22% with a decline in median price of 4%. This set of statistics is somewhat deceptive in that last July the real estate market was still in the early stages of the downturn. As the current year progresses, year over year figures will demonstrate the slide more clearly.

Comparing the first seven months of 2023 to both 2022 and 2019 (the most recent year of business not impacted by the pandemic) shows the drift of sales and prices. The number of homes sold fell 24% from 2022 (802 homes) to 2023 (607 homes), while it was down 35% from 2019 (930 homes). The Fed dropped mortgage interest rates to essentially zero during the pandemic to keep the general economy afloat, which resulted in rapid price escalation which ultimately made purchasing a home unaffordable for about 25% of potential buyers. Then to control the resulting inflation, the interest rates jumped up around the 7% mark, which further slowed the real estate market by “pricing out” another 10-15% of buyers. With fewer buyers and stagnating prices, sellers are reacting by pulling property off the market and delaying planned sales.

Median prices fell 4% from 2022 and are still 28% above the median price of Beach Cities homes in 2019.

Harbor Area Sales Volume Plummets

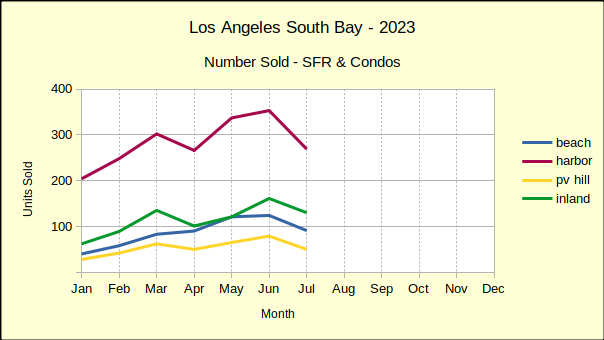
Sales volume in the Harbor area has held up better than the Beach, possibly because median price has taken a greater hit. On a monthly basis, 24% fewer homes were sold (269 in July versus 353 in June). Comparing July of 2023 to July of last year, only 18% fewer closed escrow (269 versus 329).

Generally being an entry level market, the Harbor area tends to react faster to changes in market condition. More upscale neighborhoods frequently “stick to the price” for a longer period of time when markets are declining. Month to month median price dropped 4% in July to $565K. For July of 2022 versus July of 2023, the median fell 5%, from $780K to $740K.

Year to date through July, sales volume was off 24% from last year. Median price was down 4% when compared to the same period in 2022. Looking back to 2019, the number of homes sold during the first seven months of 2023 dropped by 21%. Median price for the same time frame shows up at 32% higher than 2019. Given the median price dropped 4% over the past month (from $772K to $740K), it’s reasonable to project the Harbor area median will end the year near $600K, as it was in 2019.

PV Hill Shows Volatility

Month over month, the number of homes sold on the PV Hill fell from 79 units in June to 50 in July, a decline of 37%. At the same time, the median price dropped 10%, ending the month at $1.8M. This despite a high sale of $12.5M, up from the high of $10M in June.

Year to year, July volume dropped 6% from 53 units in 2022, while median price plummeted 18%, from last year’s $2.2M. Palos Verdes is a unique community with large homes on large lots, many of them highly custom. Combined with the small overall number of homes, these properties truly need to be assessed on an individual basis for realistic projections.

Comparing cumulative sales data for January through July, volume is down 23% and median price is down 17% versus last year. Going back to the stable year of 2019, the number of sales is down 16% while the median is up 34%.

Interestingly, if the Fed’s annual 2% inflation target is added to the years between 2019 and 2023, the median on the Hill would be $1.5M today, instead of $1.8M. Under those circumstances, it would only take a decline of $300K to erase all gain from the past three years. Not a comforting thought for anyone who purchased recently.

Inland Cities Most Stable

The Inland area typifies a classic “middle of the road” performance in the real estate world. Generally the homes are everyday family properties, the sales trends are at the middle of the current South Bay market, and everything seems to happen with minimum drama. So there is little surprise at the minimalist 19% decline in monthly sales volume, the lowest of the South Bay. Likewise there is no shock the Inland cities came in with the lowest monthly price decline, a mere 1% below June.

Similarly, the annual sales volume showed July of 2023 only 14% below last July and the median price just 1% below the same month a year ago.

Year to date for the first seven months of 2023 compared to 2022 looks much the same. The number of homes sold dropped by 22%, 799 in 2023 versus 1021 last year. The median price fell 2% to $868K from $883K. Looking back to the 2019 sales volume for the same time period, the Inland area is off by 18% for the current year. Much like the rest of the South Bay, the median price in 2023 ($868K) remains above that of 2019 ($662K) by 31%.

Photo by Alexander Simonsen on Unsplash
2023 Home Sales Volume Below Pre-Covid Levels!

The number of homes sold in the Los Angeles South Bay during the first six months of 2023 is the lowest sales volume for a first half in the past five years. Fewer homes have been sold since the new year than sold during the same period of the worst year of the pandemic.

The first half of 2023 has ended with 24% fewer sales than the same period in 2022, which was itself down 15% from 2021. The peak of the market was early 2021, when interest rates were among the lowest in history, exploding the number of potential buyers. The lowest sales volume was during 2020 when 3311 homes were sold, which was still greater than the 3221 sold the beginning of this year.

Median Price Begins Downturn

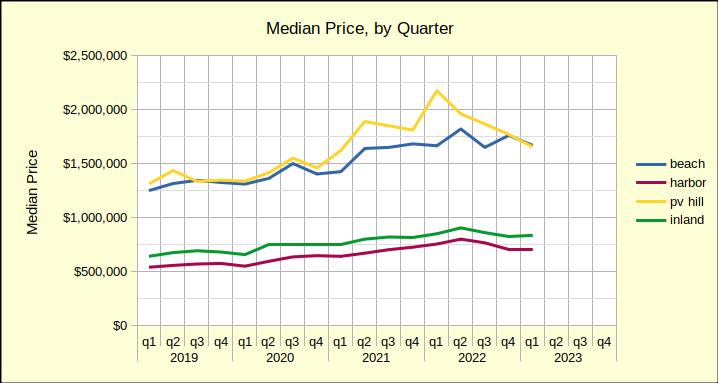
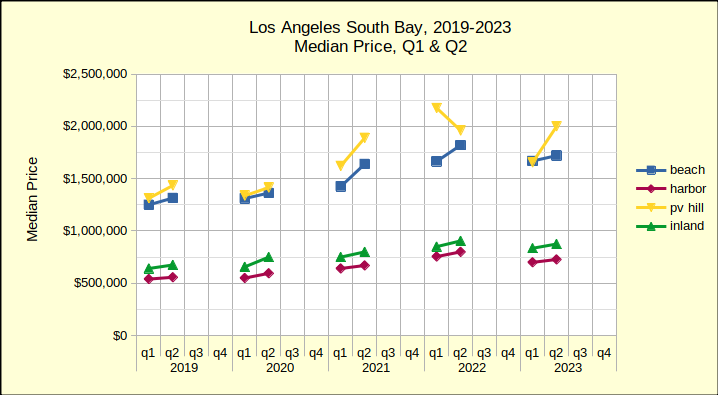
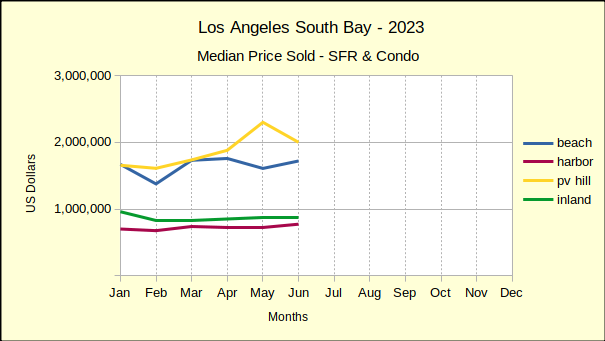
Coming right on the heels of the sales volume collapse is a drop in the median price. Prices today are down from where they were in 2022, which was the peak of the recent market. The chart below reflects the median price for the first and second quarters of the past five years. Typically, the first quarter is the slowest, with the number of sales increasing through the second quarter and then slowing again for the third and fourth quarters. Here the growth from Q1 to Q2 shows and we can see the change from year to year.

As always, bear in mind that the Palos Verdes Hill offers a comparatively small sample size, so a couple of significant sales can shift the plot lines dramatically on a chart. The chart above shows one such anomaly where PV the median price actually declines in the second quarter.

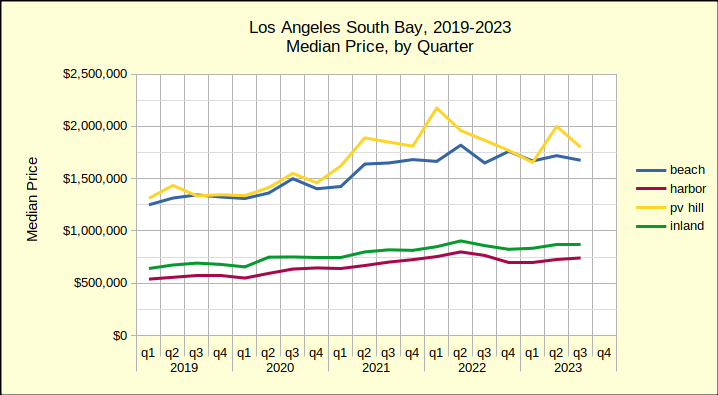
Looking across the years from 2019 all four areas show the same upward movement in median price until the second quarter of 2022. Then, comparing it to the second quarter of 2023, we can see the trend shifting downward. For example, the Beach Cities median fell from $1.82M in the second quarter of 2022 to $1.72M in the second quarter of 2023. The weakness in median prices is driven by increasingly steeper mortgage interest rates. Barring a change in market dynamics, anticipate this line turning into a steeper downslope for residential prices starting in winter of 2023/24.

When Is the Bottom?

The market is clearly taking a downward turn. Sales volume is off, median prices are turning down. Sellers are not putting properties on the market. Buyers aren’t buying. The few forecasters willing to make a guess this early are saying real estate won’t come back until 2025, possibly 2026. For those who are “waiting for the bottom of the market,” remember that by the time you read it in the headlines—you’re too late—the bottom is gone.

Beach Cities Sales Dropping Fast

Median prices at the Beach have fallen 5% from last June, coming in this year at $1.72M, an even $100,000 below June of 2022. Year to year sales for June are down 7% from last year, at 124 units compared to 133 in June of 2022.

Month over month statistics have been highly volatile since the beginnning of 2023. Interest rates and prices have changed erratically, making short term forecasts nearly impossible. Month to month sales volume has bounced in a range from 2% to 45%. In just six months, monthly median prices in the Beach Cities have ranged between -18% and 26%.

Year to date sales volume at the Beach is down 25% from last year and is off a full 35% from 2019.

The year to date median is down 3% compared to 2022, though it is still 32% above the median in 2019.

Despite market conditions, homes in the Beach Cities remain highly desirable. For June, 78% of sales transactions closed within 30 days of listing and sold for 2.61 % above asking price. Beach homes also offer a great deal of diversity. June sales showed a 19 million dollar range between the low sale at just over $500K and the high sale at $19.5M.

Harbor Area Home Sales and Prices Down

Year to year-same month sales in the Harbor area have been negative since the first of the year. Prices were still holding up in June of last year, but sales volume had been dropping through all of May and June. As a result, the number of homes sold dropped a mere 1% coming into June of 2023. That looks good until compared with the year to date decline of 24%.

Market conditions in the Harbor last year gradually changed from joy for rock bottom interest rates at the beginning of the year to caution as sales tapered off and sales figures stated taking a hit. Median prices for June of the current year have fallen 7% from the June 2022 median of $830K.

Until now, the Harbor area has shown mixed results in the month over month statistics. For June compared to May sales volume was up by 5% (353 versus 337), while median price was up 7% ($772K versus $720K). Like the Beach Cities, the Harbor Area is following a more normal upward swing from the winter doldrums into the spring selling season.

That upward swing is not expected to go very high or last very long. At 1710 homes sold, year to date sales volume from January through June is down 24% versus 2259 sold in 2022. Sales volume is likewise down 17% from 2071 during the same six months in 2019. The variance in monthly sales is expected to drop into the single digits starting in July.

Median prices are down 4% compared to 2022 though still up 33% versus 2019. (Note: Using The Federal Reserve’s “target inflation rate”of 2% annually would have put the Harbor area median price increase at a little over 8%. That implies an “excess growth” of about 25% in median price during the pandemic buying splurge. Much of that difference, if not all of it, is expected to disappear over the next 18 to 24 months.)

June sales detail shows 77% of sales closing escrow within 30 days. Buyers were still bidding up, with the sales price exceeding the list price by 2.61%. The highest sale recorded in June for the Harbor was $4.25M; while the lowest was $527.5K.

PV Peninsula Volume and Prices Mixed

Palos Verdes, contrasting May versus June of 2023 shows a 22% increase in the number of homes sold for a monthly total of 79. At the same time, the median price dropped by 13%, falling to $2M even. Expectations for month over month statistics include fewer sales and more aggressive price reductions as 2023 wears on. The summer and fall months are projected to have weaker home sales, both in volume and pricing, as interest rates increase and buyers and sellers who “must move” run out of options.

Year over year same month sales, showed a volume growth of 1% (one sale), accompanied by a 14% drop in median price from $2.3M. That 1% increase is the first time in 2023 that any of the areas has shown positive growth in the number of homes sold. As such, and knowing that the PV Hill is considerably smaller that the other areas we measure, readers are cautioned about the wide swings in PV statistics.

Sales volume for the first six months of 2023 is down 26% compared to 2022 (326 homes in 2023 versus 438 in 2022. Similarly, sales are down 9% from 2019 when sales of 358 homes were recorded. Median prices of $1.8M for the same period are down 13% from 2022 prices of $2.1M and up 36% from $1.3M in 2019.

Market time has remained good, with 75% of sales closing withing 30 days. Sellers have enjoyed selling prices 2.3% higher than asking prices, a trend expected to disappear before the end of summer. Once again showing the range of homes available in the South Bay, the high sale in PV was $10M while the low was $610K.

Inland Area Makes Strong Showing

Sales volume of 161 homes in the Inland Area for June was up 33% over sales of 121 in May. With 33% more activity came a 1% reduction in median price, which fell to $875K after reaching $880K in May.

Comparing June of this year to June of last year showed a volume decrease of 3% from 166 in 2022. Likewise, this June showed a median price decrease of 3% from last year’s $905K.

Year to date volume for the first six months was down 68%, for 669 units sold, versus 869 in 2022. Going back to 2019, the most recent “normal business year,” sales volume was down 21% from 799 sold in 2019.

Median price of Inland area homes for the same six month period showed at $863K, down 3% from $887K in 2022; and up 32% from $652K in 2019.
Days on market remained under 30 for 82% of the Inland area homes sold in June. Buyers offered 2.6% above asking price. The high market sale was $2.2M while the low was $390K.

Photo by Sebastien Gabriel on Unsplash

Spring Season Boosts Home Sales

The Snapshot: May 2023


Compared to last month, South Bay home sales look very positive, except for a little tarnish in the Beach cities prices. The sales volume was up by substantial margins in all areas. Prices were mixed with a remarkable median price increase on the Hill. The only exception: After showing positive growth for the past two months, prices at the Beach took a substantial tumble in May.


Year over year activity was an entirely different story. Sales volume was down significantly from last year in all areas. Prices took a hit everywhere except on the Palos Verdes peninsula. (More about that below.) Entry level homes in the Harbor and Inland areas were impacted the least, though even a 3% drop in a single month is significant in the world of real estate.


We report actual statistics rather than “seasonally adjusted”.numbers. May is traditionally the launch into buying season in the South Bay, so a May increase in volume from April is to be expected. On the other hand, a 10-20% decrease from May of last year indicates a heavily retrenching market. Every month since the beginning of this year, the number of homes sold in the South Bay has decreased in comparison to 2022.


Similarly, median prices across the South Bay have dropped from the highs of 2022. There have been scattered instances of positive change, like the 17% increase over May of last year for PV. Overall though, prices have been collapsing at an ever more steeply declining rate since January.


Much has been said about the steep rises and falls of sales volumes and median prices since the Covid pandemic hit in early 2020. That leaves 2019 as the last “normal” year of business. At the mid-year point we’ll give a more in depth comparison to 2023 to hopefully provide a more stable picture of the market.
In the meantime, year to date statistics for the first five months reflect an overall decline of 23% in sales volume, and an increase of 33% in median price. The sales slowdown has most affected the Beach Cities with a drop of 39%, followed by the Inland area at 21%, the harbor at 19%, and finally the PV Hill with a 14% slip. A review of the changing median prices across that many years requires adjusting for desired inflation as opposed to uncontrolled inflation.

Beach Cities: More Sold at Lower Prices


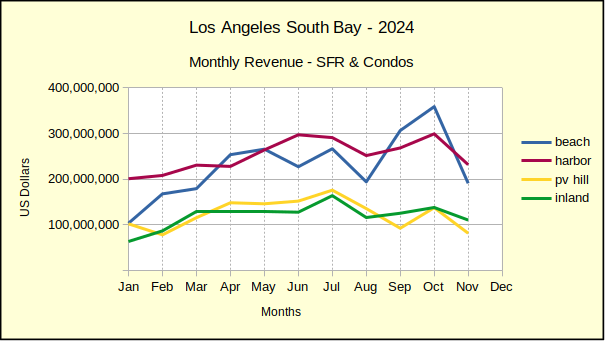
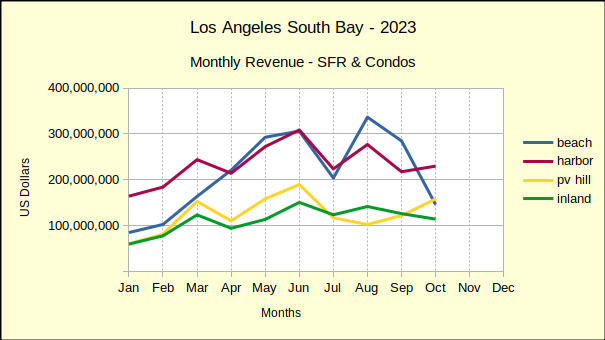
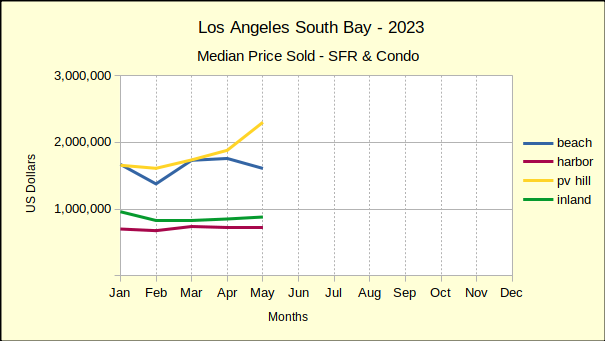
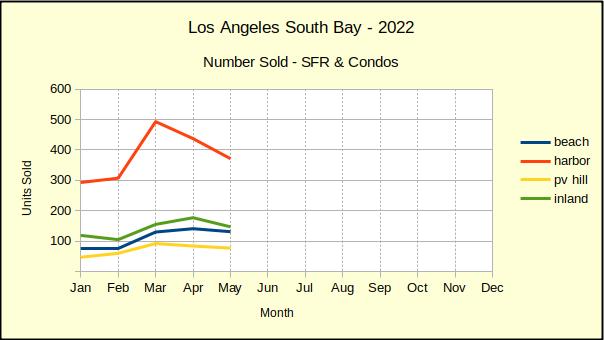
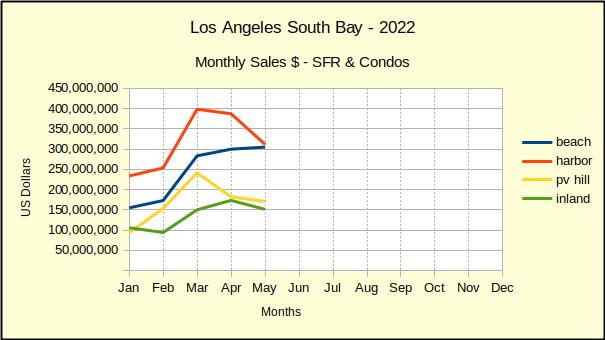
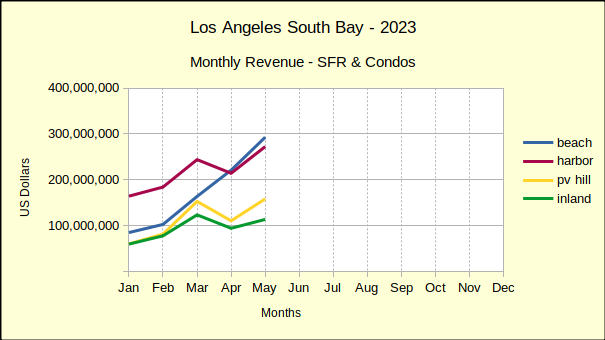
Monthly, the Beach Cities have been on a roll. Even in April, when the other three areas took a nose-dive, the Beach climbed steadily higher in both sales volume and median price. The blue line on the monthly revenue chart below shows surprisingly strong growth.


A closer look at the sales data shows some of the detail. Two of the 121 Beach area sales were on the Strand, with one selling at $18.6M and the other at over $15M. Sales in that rarefied atmosphere tend to be few and far between. In fact, one of those properties sat on the Multiple Listing Service (MLS) for almost exactly three years before it sold. With the April median price at $1.6M, the impact to the aggregate statistics becomes apparent quickly.


Market time for the Beach Cities in May was actually quite prompt, with 79% of the homes sold having spent less that 30 days on the MLS. Pricing was equally strong, with sales prices coming in at two percent above asking price. While the high sale was $18.6M on the Strand, the low was $530K at Brookside Village in Redondo Beach.

Harbor Area: Sales Up – Prices Down


As the red line in the chart below reflects, Harbor area sales entered the spring selling period with a bang! Sales volume was up 27% over April—but, remember April sales were down by 12% in the Harbor and down 13% across the South Bay. Downward pressure on prices has been showing up since the beginning of the year. Out of the first five months of 2023, month to month median prices of Harbor area homes have dropped three times. May saw a 1% decline, which was a repeat of April’s price slip.


Annual statistics cast a recessionary shadow across the picture. Looking back at May of 2022 shows the same month this year with 9% fewer sales and a drop of 5% in median price. Year to date, 2023 has lost 29% in sales volume and 5% in median price.


Compared to the first five months of 2019, the last “normal” business year, Harbor area volume was off 19%. The median price remains positive at 33% above the 2019 median. So far this year the median at the Harbor has declined an average of 5% per month. Given that rate, it’s reasonable to expect a total loss of the price gains since 2019.


Like the rest of the South Bay, the time on market for May was short as 75% of sold properties went into escrow within 30 days of listing. The low sale for the month was $269,500 and the high was $4M, a relatively high price in what is generally considered an entry level market. Interestingly, the high sale was originally listed at $9M in March of 2021, sitting on the market for two years before an accepted offer.

Palos Verdes: Home Sales & Prices Hot On The Hill


On a month to month basis, homes on the Hill came in with a 22% increase in median price, that being on top of back to back 8% increases for March and April. We’ve long said that homes on the Hill are undervalued. It looks as though that will soon be changed.


Monthly sales volume also jumped 30% for PV, though it has slowed since February and March when it was up 50% and 48% respectively. This pattern of sales increases slowing holds true for most of the South Bay. During the first quarter of 2022 the local real estate market was on fire, and then came the interest rate increases.


When the interest rates were bouncing around 5% during April and May of last year, the PV sales volume had already begun a long, slow decline. Sales figures were off by 30%-40%. So far this year, sales have continued to fall and are, in aggregate, now 31% below 2022 volumes.


Again on a year to date basis, median prices in PV are down 11%. Because the PV Hill has a comparatively small amount of homes, statistics can be volatile. June was the peak of PV business in 2022. While the summer months are typically busier and more competitive, expect this June to be less “exuberant” than May, or last June.


Like the rest of the South Bay, about 75% of homes sold on the Palos Verdes peninsula were active on the market for 30 days or less. On average, the sales price was 2.6% above the asking price.

Inland Area: Seasonal Bump In Sales and Prices


In May, the Inland area kicked off the spring selling season by pushing month to month sales volume upward 20%. While the volume of sales increased on a month to month basis, the median price went up by 4%. This seasonal bump in sales and prices contrasts sharply with the longer look of a year over year view.
Comparing May numbers from last year to this year gives a reverse result. The number of homes sold in the Inland area fell 18% from May of 2022, and the median price fell 3%, dropping back to $880K from $910K last year.. The longer perspective shows a clear decline in sales accompanied by a hint of decline in median prices.


Looking at the first five months of the year shows sales volume off in total by 68%, or an average monthly decline of nearly 15%, another indicator of the slow market. It’s joined by a 1% drop in the year to date median price.
On the positive side, 87% of the Inland area sales for May closed within 30 days of being listed. With business slip-sliding away, everyone involved is making the transactions happen as quickly and smoothly as possible. The high and the low sales figures for the Month were $1.7M and $310K, respectively. Sellers rejoiced at, and willing buyers paid, an average sales price of 2.9% above the asking price.

Photo by Lisha Riabinina on Unsplash

Home Sales Plummet 40%

April of 2023 ended with a 40% drop in the number of homes sold across the South Bay compared to 2022. The median price was down 20% from last year in Palos Verdes and is up by a mere 1% at the Beach. Year to year median prices across the South Bay are down approximately 5%. Cumulative sales revenue for the first four months across the South Bay has dropped 39% from 2022 numbers.

Year to date, 2023 has been one of the slowest markets we’ve seen in recent years. Sales are off by 43% in the Beach Cities and are down by 22% across the South Bay compared to last year. Median prices escalated dramatically in 2021-2022, and are still above those of 2019 by 30-35%. However, the median has fallen in all four areas since late last year. We anticipate the median price continuing to drop until interest rates seriously decline again.

Business in the years between 2019 and 2023 was seriously impacted by the pandemic, and the massive government funds released to counter the effect of the pandemic. Looking back at 2019 and comparing it to 2023 offers a perspective on where the market is and where we can expect it to go during the balance of the year. Today we see a huge decline in the number of homes being sold. That has yet to translate into a significant decline in median prices, although 75% of year over year sales show prices falling.

At the same time the Average Days On Market (ADOM) has increased from about 7 days during the sales boom of 2021-2022 to about 30 days now. That’s a four-fold increase in the amount of time it takes to sell a home. For a seller who needs to move, that will feel like an eternity. It’s that sense of urgency that drives prices down and ultimately results in a shift of the market.

At the Beach “Sticky Prices”

Sellers in the Beach Cities had a good month in April—at least compared to March of this year. Compared to April of last year, the picture is far worse.

The number of homes sold in April was up 8% compared to March. That sounds positive, until the realization that sales volume was down 36% compared to April of 2022. At the same time, the median price was up 2% versus last month, and down 2% compared to the same month last year.


There’s a lot of talk among brokers these days about “sticky prices.” Recent sales at the Beach offer a good example of what that means. The statistics show that sales are down 36% from last year, however prices have only dropped 2%. Sales are falling because the number of viable buyers is down.

Interest rate increases have pushed the most tenuous group of prospective buyers out of the market. At the same time, sellers are still revelling in the boost to median prices that came with record low interest rates during the pandemic. Beach area sellers have yet to adjust to the reality of a re-trenching economy. That adjustment is “sticky prices.”

Harbor Sales and Prices Off

The neighborhood can affect how long it takes the median price to respond to changes in the economic environment. While sales volume and pricing has remained strong at the Beach, sellers and buyers in entry level communities are impacted more immediately by shifts in the economy.

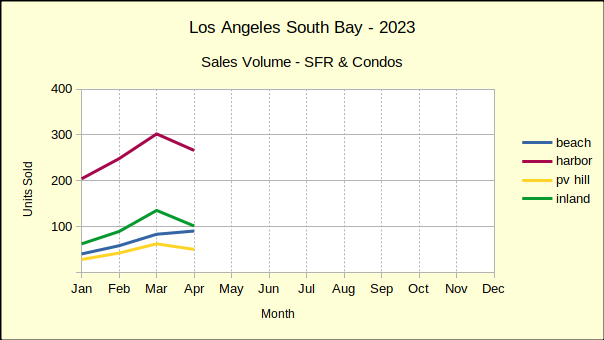
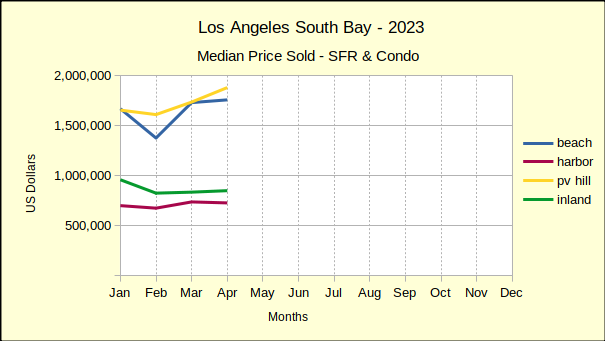
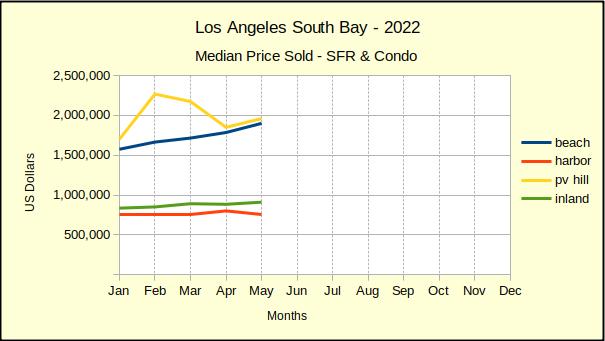
Thus we see the give and take of the market bring median prices into a stable range early in the year in the Harbor area. The red line in the median price chart below shows four months of reasonably steady prices. While month over month prices have shown only a 1% drop, the monthly sales volume has taken a 12% dive from March, as shown in the Sales Volume chart, above.


The monthly decline in sales was multiplied in the year over year statistics. April sales volume was down 39% from April of 2022. For the same period, the declining sales volume was coupled with a 9% drop in median price. So the entry level communities demonstrate a much quicker and deeper response to changes in the financial picture.

Part of that response is the time on market, which has risen from 15 ADOM in mid-2021 to 26 ADOM in April of this year. The increasing time required to sell homes contributes to the number of homes available on the market. Both factors contribute to falling purchase prices.

Palos Verdes In Extremes

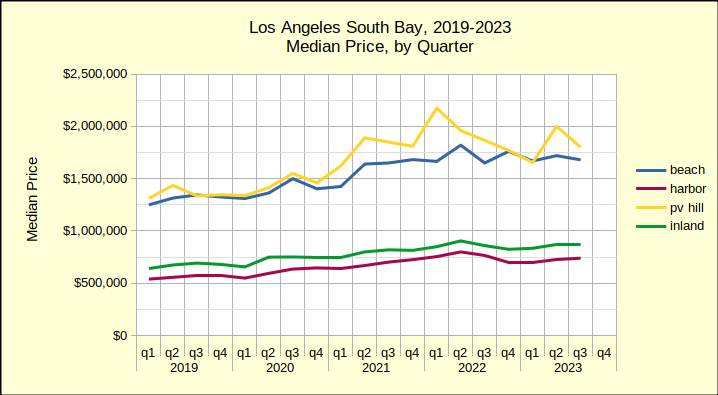
Through 2021 and 2022 home prices on the Palos Verdes peninsula benefitted from the Covid pandemic more than any area in the South Bay. In the median price by quarter chart, shown below, the yellow line is seen jumping up and away from the blue line of the Beach Cities. Unfortunately for home owners on the Hill, that price boost has already pulled back into line with prices of Beach area homes.

Comparing the first four months of the 2023 to 2022 median prices on the Hill have dropped 16%. It’s a steep decline in view of decreases at 3% and 6% in the Inland and Harbor areas, respectively. Even more so when looking at the 1% increase at the Beach.


The statistics look much better when comparing Palos Verdes sales from 2023 to statistics from 2019, the last “normal” year of real estate business. Sales volume on the Hill is down a modest 13%–modest by comparison to the Beach, which is down 43%. In contrast, median prices in 2023, compared to 2019, are still showing positive growth of 30%.

So, if one were to take the Federal Reserve System position that 2% annual growth is a desirable target, where would prices be today? The median price in Palos Verdes in May of 2019 was $1.5M. Jump forward to 2023 and that becomes about $1.6M. The median on the Hill last month was $1.9M, which suggests further price reductions.

Inland – The Steepest Fall

From an investment perspective, homes in the Inland area of the Los Angeles South Bay are “bread and butter.” These are the homes, much like those in the Harbor area, which reliably increase in value over long periods of time at a slow and steady rate. Most importantly, they house the bulk of our community.

In the short term, Inland home sales volume is down 25% from March to April of this year. Median prices are up 2% for the same period. This is the steepest fall in number of homes sold in the four areas charted.

Year over year, sales volume is off even more at 43% below April of 2022, and prices similarly down by 4%. We expect a seasonal boost to sales for the second quarter, when families most frequently schedule moves. Beyond that, most predictions are for continued softening in the real estate market as the Fed struggles with inflation. (The April Consumer Price Index, [CPI-U] for Los Angeles metro was 5.2% for Housing.)

Photo by Bradley Pisney on Unsplash
The Short & the Long of South Bay Home Sales

A glance at the table below confirms that year over year statistics are overwhelming the monthly numbers. Buyers were out there buying in March, and they were buying more than they did in February, which was up from January. That’s to be expected. We report actual numbers, as opposed to “seasonally adjusted,” so coming from the depths of winter into spring always increases real estate activity.

Because of that simple fact, the year over year statistics are far more important as an indicator of where the market may be headed. The big increase in March sales doesn’t offset how far down sales volume has gone since last year. Nor does it hint at the level to which median prices are taking a hit.

Compared to last year, sales volume is off by a third in nearly all areas of the Los Angeles South Bay. Median prices haven’t dropped nearly as large a percentage, but we can clearly see the direction. The Federal Reserve System (Fed) comment in the April “Beige Book” said it all: “Residential and commercial real estate activity fell, and lending activity declined substantially.

Beach Cities Median Still Rising

As the over-all real estate market begins a dive into the depths of a Fed-induced recession, we find the Beach Cities as the only remaining local market with year-over-year positive median price growth. It’s not much. A mere 1% growth over March of 2022 is hardly an investment recommendation, especially with inflation running around 6%. And, the rest of the Los Angeles South Bay is already negative compared to this time last year.

This is the second time in 2023 buyers at the Beach have nudged the median price up while the rest of the residential market fell. January showed a 6% increase which collapsed February in a 17% free fall. February’s dismal numbers contributed to what looks like a good March in the month to month measurement.

Staying positive in March appears to be predominately the result of a single sale in Hermosa Beach. At nearly 5000 sq ft, with stunning ocean views, the property was bid up from its $5M dollar list price to just over $6M, closing with a cash offer in only 12 days. Without that transaction the Beach Cities marketplace would have stood at 0% growth.

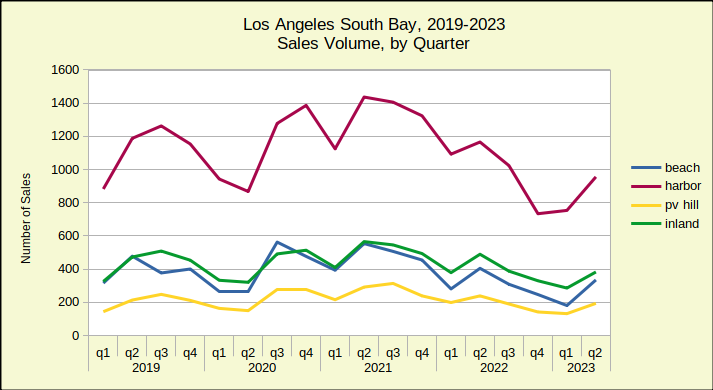
The big story at the Beach is the sales volume versus the most recent “normal” year of real estate business. The chart below shows the number of homes sold in each of the South Bay areas, with seasonal shifts.

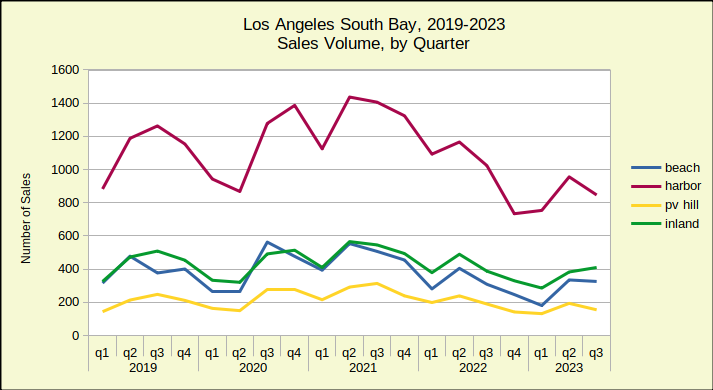
Notice that 2019, the last normal year, begins low, with few sales in the winter months. Sales peak in quarter three, in the heat of summer, then decline back down to about where they started.

Compare that to what happened in 2022, when everything seemed to head down.

Only 83 homes were sold in March of this year, and only 181 homes sold across the first quarter of 2023. In 2019 the area averaged monthly sales of over 100 units; approximately 425 homes per quarter. That amounts to a 43% decline in the number of sales compared to pre-pandemic levels.

As this is written there are 152 homes available in the Beach Cities with an average of 62 days on market. Both, the level of inventory and the time on market are increasing daily. Those factors, especially working together, will cause price decreases. With a constantly increasing mortgage interest rate, there’s little doubt the valuation gains of the pandemic era will not hold up to the recession in the world of real estate.

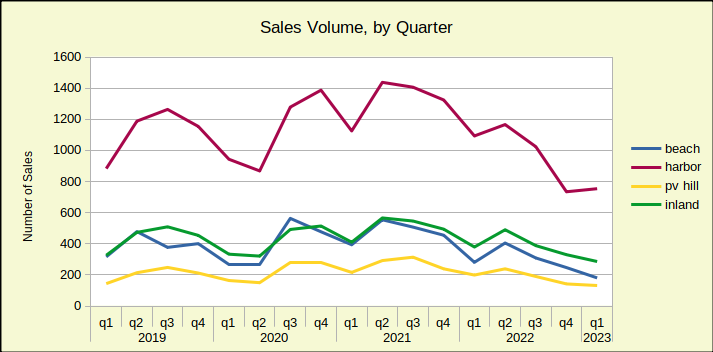
Harbor Area Sales Volume Plummets 39%

The Sales Volume, by Quarter chart above shows relatively synchronous movement across time by three of the four areas. The fourth area, the Harbor, floats at the top of the sales volume chart. Similarly, the Harbor area sinks to the bottom of the median price chart.

Homes in the Harbor area are typically what’s known as “entry level.” They are small homes, often condominiums, and are priced at the bottom of the scale. These are the homes newly wed couples buy, and the homes that house growing families. They are the type of properties occupied by most Angelenos, whether they be homeowners or tenants.

None of that explains the huge swings, though. What does is family economics—cash flow. When both prices and interest rates are low, the entry level market sings. When the cost of home ownership rises, this is the first area to fall and it usually falls the deepest. March sales across the Harbor dropped by 39% from March of 2022. At the same time median pricing at the Harbor dropped 2%–not nearly enough to offset interest rates that are running in the 6%-7% range. Until the mortgage interest rate goes down, or the asking price drops, or both, this market is going to be slow.

Inventory is currently 336 homes on the market, with time on the market averaging 60 days.

Median Down 20% for Homes on the PV Hill

Even more volatile than the Beach, homes on the Palos Verdes Peninsula dropped over a half million dollars in median price from the first quarter of 2022 to the first quarter of 2023. That steep yellow line on the chart below shows the downward direction of home prices in the area. Interestingly, the Beach Cities and the PV Hill declines have been almost exactly the same for the past 90 days.

As noted above, the Peninsula, with its large lots and relatively few homes, invariably shows a lot of volatility. The 20% drop in year over year median price is matched by a 33% drop in sales volume since March of 2022. Much of the median price increase seen last year resulted from a series of new construction sales. Those newly built homes came in at top dollar and helped elevate the median price nicely.

Builders are now anticipating a long, slow recession/recovery, so the PV market is not likely to see that benefit come back for a few years.

This newsletter focuses on residential, but it should be noted the Palos Verdes commercial marketplace has also taken a significant hit since the pandemic. Retail lease prices are at rock bottom and lots of space is available. It would not be surprising to see some of the older commercial space re-configured to meet residential needs. Such a transition could help the cities on the Hill meet their obligation to the State for additional residential construction to alleviate the housing shortage.

Inventory today shows 83 homes available, with an average time of 80 days on the market.

Stability Marks the Inland Area

The “family friendly” Inland Area is surrounded on three sides by the Beach Cities, PV Hill and the Harbor Area. It’s a quiet environment, usually without the drama and speculation found in the more upscale Beach and Hill areas. Anchored by Torrance, the market direction is normally the same as the rest of the South Bay, without the more radical ups and downs. March real estate activity reflected that nature in price and sales volume compared to March of last year.

The “Median Price by Quarter” chart above shows a year over year decrease of 6%, in keeping with annual results from the Hill and Harbor areas. The chart also shows a long, steady green line that doesn’t offer surprises, or dramatic movements in any direction. The current recession is expected to bring prices down somewhat, making the Inland area an excellent target for home buyers, or investors during the coming months.

Available as of this writing, are 130 homes. In keeping with the Inland image of slow and steady, the statistics still show only an average of 47 days on the market. Compare that to 80 on the Hill and 62 at the Beach. Buyers are more abundant here, as long as mortgage interest rates are affordable.

Footnotes

The areas are:
Beach: includes the cities of El Segundo, Manhattan Beach, Hermosa Beach and Redondo Beach;
PV Hill: includes the cities of Palos Verdes Estates, Rancho Palos Verdes, Rolling Hills and Rolling Hills Estates;
Harbor: includes the cities of San Pedro, Long Beach, Wilmington, Harbor City and Carson;
Inland: includes the cities of Torrance, Gardena and Lomita.

Photo by Rich Brents on Unsplash

Recession Drives Price Reductions

Median Price Tumbles

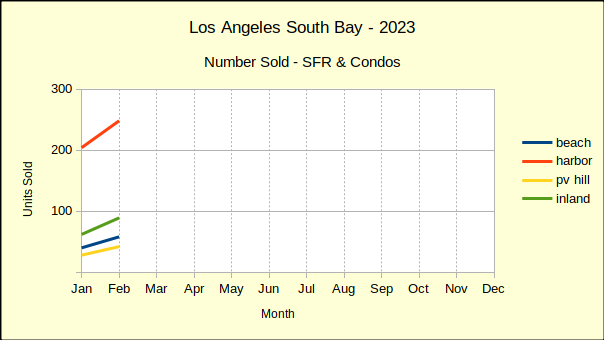
Last year ended with sales volume off, median prices coming down and revenue dropping fast. January showed little change. February of this year shows sales volume up from January by as much as 50%. The reason why is obvious–the median price is simultaneously dropping by percentages as high as 18%.

Comparing February activity to February a year ago shows significant declines in both sales volume and in median price. At that point in 2022 the market was just beginning to dip a toe in the recessionary waters. Now we’re wading into it.

The first week of March Fed Chairman Jerome Powell told Congress, “…the ultimate level of interest rates is likely to be higher than previously anticipated.” Powell’s pointed remark clearly tells us the most recent pause in interest rate hikes is momentary. The lowest local mortgage rates we could find at the time was 6.75%. As such, we anticipate rates in excess of 7% by summer.

February Sales Volume Climbs

About the second week of January mortgage lenders began loosening the interest rates in anticipation of a relaxation by the Federal Reserve. For the most part, local rates stayed below 6% until late in February when the Fed began dropping hints that inflation was still raging.

After a “soft” January, sellers in the market were dropping prices and buyers responding positively by making offers. Now that mortgage rates have resumed climbing, sellers will have to drop prices some more to remain attractive to buyers.

With only two months behind us this year, there are indications lenders will “see-saw” the rates throughout the year. Already this year we have seen retail mortgage rates moving up and moving down without influence from the Fed. It seems to be an effort to induce buyers to accept high interest rates based on the theory they were higher last week so this temporary reduction is a good deal.

Revenue Climbs From January Depth

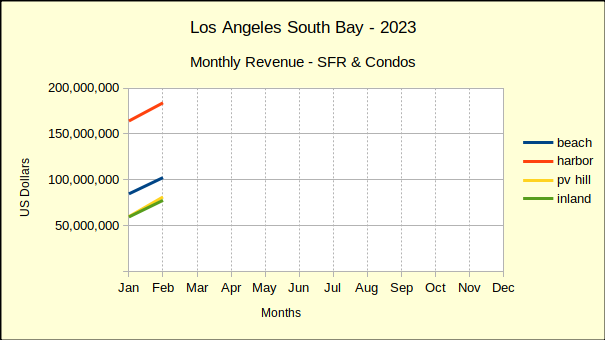
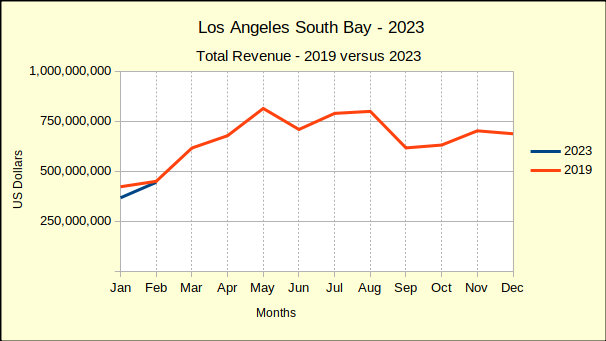
On a month-to-month basis, revenue across the South Bay is up 21% from January of this year. Don’t get excited—it’s only one month. January was one of the lowest performing months we’ve seen recently.

On a year-over-year basis, revenue is down 34% from last February! January was 38% lower than January of 2022. Year to date through February, revenue in the South Bay is down 36% and is expected to continue falling.

One of the more important statistics to note is how 2023 activity compares to 2019, which was the most recent “normal” year of real estate business. Across the South Bay real estate revenue for the first two months of 2023 is 7% below the same period in 2019. Restated, the South Bay has already lost over four years of gain in real estate revenue.

Median Price Slips, Volume Rises

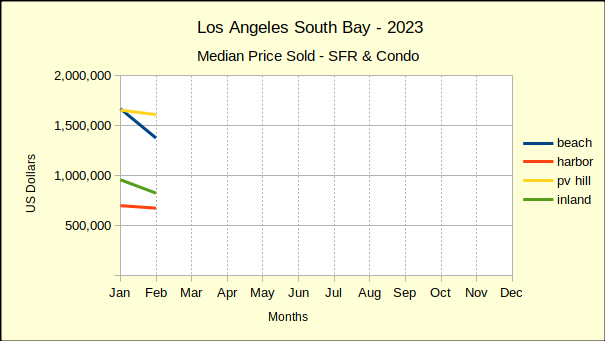
More units of housing were sold in February than January, and the median price was lower in February. The Beach Cities saw a drop of 18% from January while the PV Hill held the decline to 3%. The Harbor area fell 4% and the Inland area dropped 14%.

Comparing February of this year to February of 2022 brought a harsher focus to the picture. All four areas have fallen from last years median price. The Beach is down 17%, the Harbor down 11%, the Hill is off 29% and the Inland cities down just 3%.

2023 Versus 2019 Shows a Sinking Market

The summary numbers comparing the first two months of 2023 to the most recent “normal” year of 2019 are not encouraging. Overall, sales revenue has fallen 7% below revenue figures for the same period in 2019. The Harbor area has fared the best, showing a 9% increase in revenue over January and February activity in 2019. Of course, that was four years ago and classic inflation would give that type of gain. It’s clear the “inflation on steriods” we’ve been experiencing is gone from the real estate industry.

The Beach cities provide an excellent indication of where the real estate economy is going. The first two months of revenue for 2023 is down 32%. Palos Verdes is down 2%, while the Inland area is up be a mere 1%. After four years of pandemic, recession, inflation and Federal Reserve manipulation the real estate market is tanking.

Disclosures:

The areas are:
Beach: includes the cities of El Segundo, Manhattan Beach, Hermosa Beach and Redondo Beach;
PV Hill: includes the cities of Palos Verdes Estates, Rancho Palos Verdes, Rolling Hills and Rolling Hills Estates;
Harbor: includes the cities of San Pedro, Long Beach, Wilmington, Harbor City and Carson;
Inland: includes the cities of Torrance, Gardena and Lomita.

Photo by Ussama Azam on Unsplash

2022 South Bay Real Estate Wrap

We’re taking a little different approach with this post. Because it’s not only the end of the month, but the end of the year, we’re doing a quick summary of the monthly data, followed by some more detailed discussion of how the individual areas have fared over the past year. We’ll even try some crystal gazing while we walk through the annual data for each neighborhood.

This is a great place to bring in our At A Glance table. It displays in just a few numbers how all the areas of the LA South Bay are doing compared to last month, and compared to this same month last year.

Looking at December vs November, once again the percentage of unsold homes has increased and the number of homes sold below last month’s median price has also marginally increased. More importantly, on a year over year basis the amount of red ink is even greater. Losses in number of sales and in the value of those sales is clearly growing.

Despite all the negative numbers, there may be a light in the future. For the past couple weeks we have observed a softening in the mortgage interest rates. If that turns out to be more than a mid-winter teaser rate, this spring may shine a bit brighter than previously anticipated. We’re not holding our breath though. Recent speeches from Federal Reserve Bank leaders have stated a clear intent to “hold the line” on driving down inflation with mortgage interest rate increases.

Beach Cities Home Sales Down 47%

Compared to 2021, fewer homes have been sold in the Beach Cities every month of 2022 than the same month the previous year. January started the trend with a decline of 28% versus the number of homes sold in 2021. That difference continued to increase all year. By December sales were 47% lower than the previous December.

As the interest rates climbed, the number of home sales dropped. Looking at the total sales volume for the year, 35% fewer homes were sold in the Beach area during 2022, than were sold in 2021. Of course, 2020 and 2021 were the highly erratic pandemic years. So, looking into sales at the Beach for the last few years we find the number of homes sold has already dropped 21% below the number sold during 2019, our last normal economic year. Effectively, the Covid-19 pandemic created. Then erased any gains of the past three years at the Beach.

Homes sold in: 2019 – 1572 (market normal)
2020 – 1572 (market direction down six months, up six months)
2021 – 1910 (market direction down two months, up ten months)
2022 – 1242 (market direction down twelve months)

While the Beach Cities suffered the largest drop in sales volume for 2022, the South Bay as a whole has also dropped below the sales figures for 2019.

Sales Volume Down Across the Board

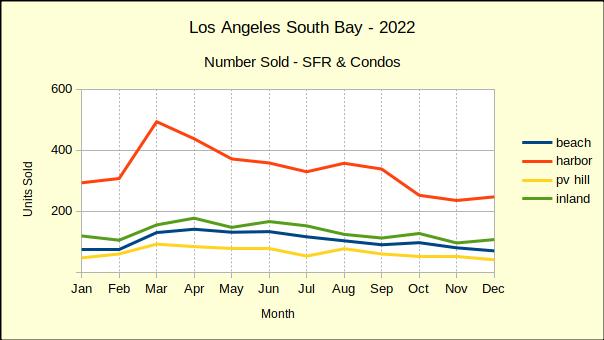
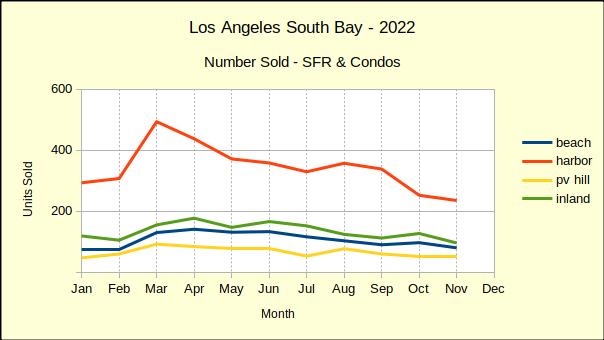
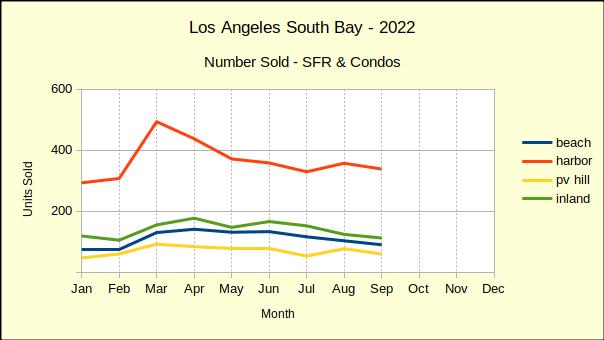
All areas started the 2022 year down from the prior month and down from the same month in the prior year. February results were mixed with the Harbor and Palos Verdes areas showing stronger results. March sales jumped up as buyers realized the rising interest rates were about to price them out of the market. From April on, sales volume across the South Bay was trending down on a year over year basis.

In sheer number of sales, the Harbor area fell the farthest. In 2021 annual sales 5292 homes were sold in the Harbor cities, while in 2022 the number dropped to 4017. That amounted to only a 24% decrease compared to the 35% annual collapse in the Beach areas.

On a month to prior month measure, sales declined six months out of nine across the South Bay. Occasionally one or two areas would post a positive sales month, but in the end, 2022 showed a 26% drop in sales volume from 2021 across the South Bay.

Sales Dollars Diving

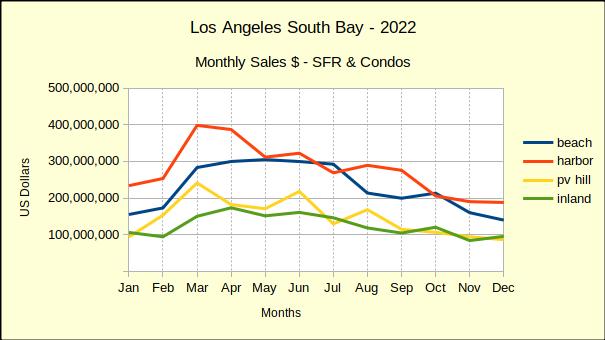
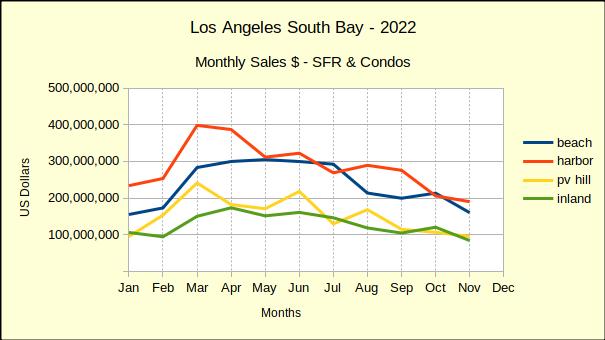
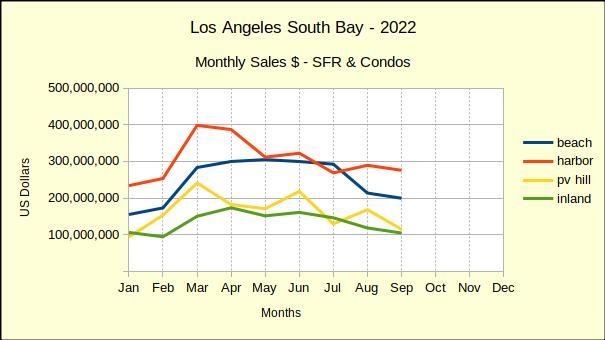
With the number of sales dropping in a range of 25% to 50% it’s not a surprise to discover the total dollar value of those sales has taken a dive. As the chart below shows, the first quarter of the year was generally positive, then reality set in and the buyers started walking away. The rest of the year was little more than a measure of the recession.

Monthly revenue in the Harbor area alone dropped $200 million between March and December. The Beach cities and the Palos Verdes area lost about $150 million a month in sales value. Inland area sales for the same period are off approximately $75 million.

One should consider these declines in the context of the pandemic. Early on, while much of the world was in lockdown, the government flooded the citizenry with easy money, hoping to keep the economy afloat. Mortgage interest rates were already at the bottom because the economy was just recovering from the last recession. The result was a real estate boom starting in summer of 2021, which continued until March of 2022.

The housing market is now in the “bust” part of the cycle and we anticipate it to last through 2023. Gross sales across the South Bay jumped up from $8 billion in 2019 to $12 billion in 2021. That’s clearly unsustainable, especially from the perspective of a Federal Reserve System which is looking for 2% growth. So far the market decline has taken back about 23% of that $4 billion bubble.

Median Price Is Slipping

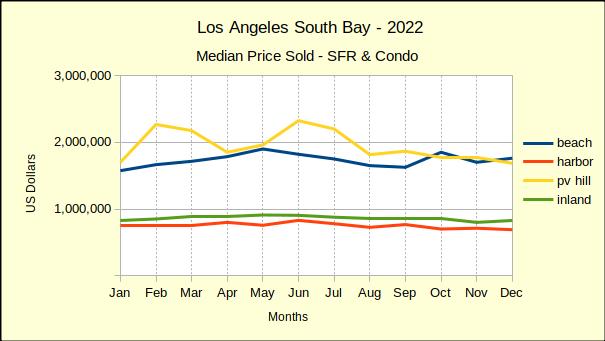
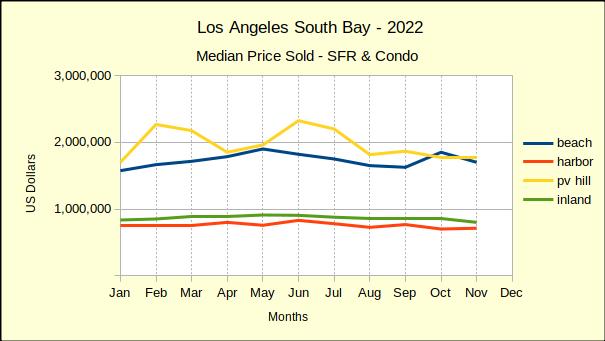
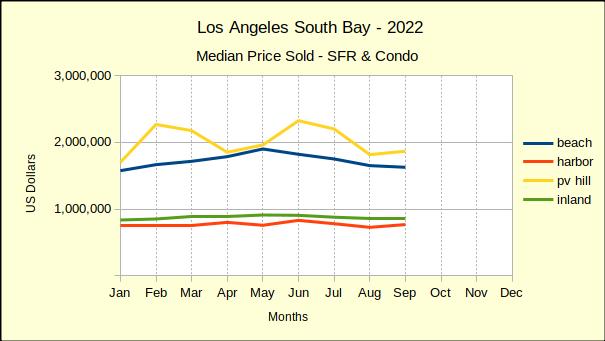
There is a lull between when buyers stop buying and prices start dropping. Most sellers need to see headlines about the market change before they make a price reduction. Median prices started to slide in August at the Beach and on PV Hill. The year ended with most areas having experienced multiple monthly declines in the median price. Despite that, median prices still exceeded those of 2021 by roughly 7%.

Comparing 2022 to 2019 better shows the inflation factor. Generally speaking the South Bay ended the year with median prices 30%-35% higher than they were in 2019.

The Palos Verdes market is comparatively small, thus is typically volatile on a monthly basis. The yellow line on the chart above shows the range of high and low median prices. Since mid-year the median price has drifted down and merged into the downward trend.

Year End Versus 2019

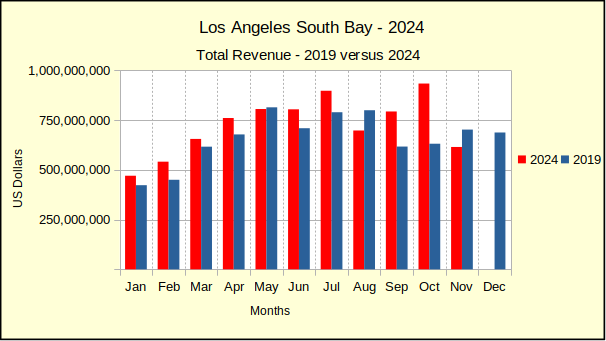
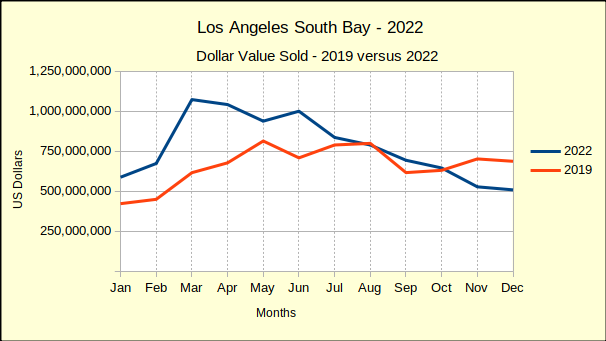
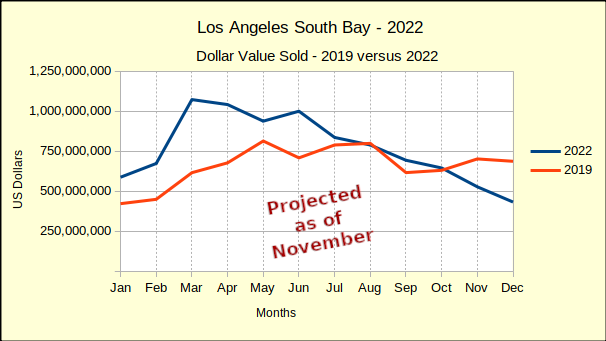
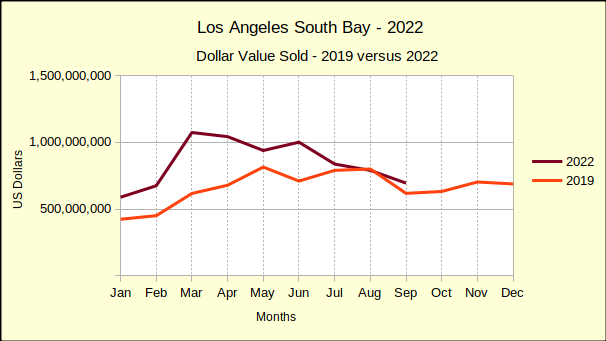
We’ve been comparing 2022 to 2019 all year because real estate sales during the height of the pandemic were so out of the ordinary, regular year over year comparisons yielded untenable results. The chart below depicts the current year total sales for the South Bay compared to sales from 2019.

Tracking the blue line, one can see where sales dropped below 2019 values in August, recovered in September, then slipped below again for the fourth quarter of the year. December sales didn’t fall quite as far as projected, but still came in about $200 million less than December of 2019.

The end of the year reflected accumulated sales of approximately $9.3 billion. That would mean 2022 total dollar sales come in at $1.3 billion above the $8 billion total dollar value sold in 2019. Across the South Bay that was an 18% increase.

Broken out by community, we found total dollars sold in the Beach cities to be 4% above 2019, followed by the Inland area with a 20% increase. Harbor came in next with a 21% increase and the PV Hill with a 35% increase.

We expect both sales volume and median price to continue declining through most, if not all, of 2023. By mid-year of 2024 there should be evidence of the beginnings of a recovery.

Disclosures:

The areas are:
Beach: includes the cities of El Segundo, Manhattan Beach, Hermosa Beach and Redondo Beach;
PV Hill: includes the cities of Palos Verdes Estates, Rancho Palos Verdes, Rolling Hills and Rolling Hills Estates;
Harbor: includes the cities of San Pedro, Long Beach, Wilmington, Harbor City and Carson;
Inland: includes the cities of Torrance, Gardena and Lomita.

Photo by T Narr on Unsplash
The Recession Continues – November Home Sales

Home Sales Plunge

November saw the number of homes sold in the South Bay fall 12% from October totals. Sales volume has declined in seven of the eleven months on a month to month basis since the beginning of the year. Sales tipped up a modest 2% on Palos Verdes peninsula, while volume dropped 7% at the Harbor, 18% at the Beach and 24% in the Inland area.

Year over year sales look even more depressed with a 45% drop from 2021 sales across the South Bay. The Beach Cities led the plunge with a 50% fall, followed by the Harbor area at 46%. Palos Verdes and the Inland area brought up the rear with 35% and 41% respectively. The falloff in sales began with a 17% drop in January and has been increasingly negative since.

Because 2020 and 2021 were both significantly impacted by the coronavirus pandemic and the governmental response to it, 2019 is the most recent year with a normal business pattern. Comparing 2022 sales volume with 2019 provides the truest measure of the current recession. Overall, for the first 11 months of the year, the South Bay has experienced a 9% decline in sales compared to 2019.

Through the month of November, sales on the PV Hill have fared the best, showing a modest drop of 3% compared to the same time period in 2019. The Harbor and Inland areas which generally are entry level for the South Bay both fell back 8% for the same period. So far this year the Beach Area has suffered the largest declines with an 18% drop in number of sales versus 2019.

Annual Sales Dollars Off By $3.2 Billion

Comparing year-to-date sales of homes in the Los Angeles South Bay shows a drop in dollar value from 2021 to 2022 of over $3.2 billion. That represents an over-all decline of 22% in total dollars sold from the same 11-month period last year.

The Beach area has been the hardest hit so far with a drop of 34%. The PV Hill has dropped 29%, while the Harbor area has fallen 22%. The Inland area fared the best, only down 19% for the same 11 months.

On a month to month basis, the decline in sales accelerated from 7% in October to 18% in November. The Inland area which had flipped to a positive gain in October plummeted by 30% in November. Similarly the Beach which had been up 7% in October fell 25% in November. The Harbor and Hill areas were off by 8% and 11% respectively.

At this point year to date South Bay sales dollars for 2022 still exceed the total for 2019 by 22%. We expect the end of year numbers to be positive. However, with monthly sales figures shrinking by 30%-40%, we project 2023 to fall below 2019.

Median Price Shows Mixed Results

Statistically speaking, the Beach cities median price fell 8% from October to November. The reality is that the median in October was unusually high. Multiple sales of Strand property drove the median up 14% that month. The blue line on the chart below shows the one month blip and median prices dropping back to a steeper downward pace in November.

Palos Verdes was flat compared to the previous month. This is a rare event as one can see by the erratic yellow line on the chart. Because the physical area is smaller than the other geographical areas, the number of sales is smaller, and mathematically the sample size is smaller. Thus one or two outlier sales can create wide swings in the chart.

Similar to the Beach area, the median price dropped 7% in the Inland area. This decline follows two months of no change, preceded by three months of month over month negative median prices.

At the same time the Harbor area experienced a month to month increase of 2% in the median price. Researching this anomaly we discovered 11 new construction sales in Carson had been accumulated and posted simultaneously by the developer. It’s worth noting that Harbor area median prices have also been elevated to some extent by the new construction on Western Avenue in San Pedro.

From a year over year perspective, November median prices continued to fall in comparison to those of November 2021. The Harbor and PV Hill areas were down 5% and 2%, respectively. Median price in the Inland area dropped from positive 6% in October to negative .05% in November. The Beach cities remained positive with growth of 1% in November. That being in contrast to an unexpected growth of 20% last month caused by the sale of multiple Strand properties in Manhattan Beach.

Despite increasingly deep reductions in sales volume and in median price throughout this year, the median is still higher than it was in 2019. Palos Verdes home owners have fared the best with the current median price 40% above the November 2019 median. The Harbor area is still 34% higher and the Beach cities still maintain a 31% advantage. The Inland area has proven to be relatively stable throughout the pandemic and currently the median price is 27% above that of 2019 for the same 11 month period.

Year End Projection Updated

We’ve been comparing 2022 to 2019 all year because real estate sales during the height of the pandemic were so out of the ordinary, regular year over year comparisons yielded untenable results. The chart below depicts the current year total sales for the South Bay compared to sales from 2019.

Tracking the blue line, one can see where sales dropped below 2019 values in August, recovered in September, then slipped below again in October and November. Assuming the decline continues at the same rate, we are forecasting the December sales to drop another $75 million, or so.

The end of the year would then reflect accumulated sales of approximately $9.4 billion. That would mean 2022 total dollar sales come in at $1.4 billion above the $8 billion total dollar value sold in 2019. Across the South Bay that would be approximately an 18% increase.

Broken out by community, we forecast total dollars sold in the Beach cities to be 6% above 2019, followed by the Inland area with a 20% increase. Harbor comes in next with a 21% increase and the PV Hill with a 35% increase.

At a Glance

As 2022 draws to a close we find the final numbers for both sales volume and median price show the year to be rapidly declining from the final figures for 2021. However, the totals all remain positive. We expect December to continue the trend downward, though the year should end on a positive note.

With the number of units sold decreasing every month by 35% to 50%, and the median price now falling, 2023 should be firmly in the grip of the recession by mid-year.

Disclosures:

The areas are:
Beach: comprises the cities of El Segundo, Manhattan Beach, Hermosa Beach and Redondo Beach;
PV Hill: comprises the cities of Palos Verdes Estates, Rancho Palos Verdes, Rolling Hills and Rolling Hills Estates;
Harbor: comprises the cities of San Pedro, Long Beach, Wilmington, Harbor City and Carson;
Inland: comprises the cities of Torrance, Gardena and Lomita.

Photo by Elias Shankaji on https://unsplash.com/

Despite GDP Growth, Real Estate Is Still On A Downturn

Although it was undeclared, we’ve been in a recession, which is usually indicated by two consecutive quarters of gross domestic product (GDP) loss. GDP has been going down, but now suddenly GDP is going back up. So does that mean we are out of the recession? Well, if it had ever been declared, it would be declared over — but that doesn’t mean it actually is, especially since it was never declared to begin with.

GDP is ultimately based on consumer spending. When consumers spend more, GDP goes up. This is indeed what happened. However, that isn’t necessarily a good thing. You may have read one of my posts from a few days ago about plummeting savings rates. As stated in that post, savings rates have recently dropped dramatically, which is normally an indicator of consumer confidence, but in this situation is actually a result of necessity due to increasing costs of living. In other words, inflation occurs, consumers must spend more to buy the products they need, therefore GDP goes up. We tend to think of GDP increases as good, but the reality is that it’s simply a mathematical value that can shift as a result of a variety of different factors, both positive and negative.

Photo by Thomas T on Unsplash

More: https://journal.firsttuesday.us/economic-recession-or-not-the-housing-market-recession-is-here/87069/

A Recession on the Horizon

September Home Sales Down 35%

Last year saw home sales in the South Bay escalate dramatically as buyers sought to become homeowners while interest rates were still abnormally low. With interest rates rapidly rising it’s no surprise that sales are plummetting in 2022. The Harbor area, traditionally an entry level market, handily out-sold the balance of the South Bay with a drop of only 26%. The remaining areas suffered sales drops ranging from 42% to 47%, with the South Bay as a whole dropping 35%.

Compared to last year, cumulative South Bay home sales were down 21% as of September. The first three quarters of 2021 saw 7767 townhomes and single family residences sold, versus 6163 during the same period this year.

Recognizing that 2020 and 2021 were exceptionally aberrant, we also compared the 2022 year-to-date sales volume to 2019, the last normal year of business prior to the pandemic. As of the end of September 2022 cumulative sales volume was 4% lower than it was for the first nine months of 2019.

The decline from 2019 sales is uneven in that the biggest drop, 15%, is seen in the Beach area, which is typically at the high end of the market. Sales in the Harbor area only dropped back by 2%, while sales in the Inland area fell by 4%. The Palos Verdes peninsula fared best, actually increasing in quantity sold over 2019 by 4%. As always we offer a cautionary note when looking at statistics for property on the PV Hill. Because there are considerably fewer homes in that area, percentile statistics can take large swings.

Median Prices Mixed in September

The number of homes sold in 2022 has declined, indirectly affecting the median price of those homes, as well as the total dollar value of all the homes sold in the same period. A closer look at the median price of homes sold through September yields some surprising changes.

Since prices increased dramatically during the coronavirus pandemic we anticipated finding the median price from 2022 to be considerably higher than that of 2019. Indeed, that is the case with the median in the Beach area up 31% over that of 2019, the Harbor up 36%, PV Hill homes up a staggering 47% and the Inland area up 30%. But, that is gradually reversing.

July and August of this year showed depreciation in the median price across the South Bay. Prices consistently dropped in a range from 2% down (Inland) to 18% down on PV Hill. September sales broke the pattern with only the Beach cities losing value per the median. The Inland area was flat, showing no change from August. In an unexpected twist, both the Harbor area and the Hill came in with an increase in the median price. The growth was modest, up 6% for the Harbor area and up 3% for the Hill. Despite the slight improvement in September prices we anticipate continued downward pressure as inventory grows and time on market stretches.

Looking at the median price on a year-over-year basis, we find September with minor declines from August. The Palos Verdes cities showed prices dropping by 2% last month and this month. At the same time the Beach cities dropped 2%, while the Harbor and Inland areas increased by 4% and 2% respectively.

Median prices started 2022 with increases regularly coming in well above 10% growth. In April we saw the first negative where the median for the Hill fell 2% from 2021. Since then we have watched the rate of price appreciation decline from double digits until now in September with both the Beach and PV areas losing value.

We fully expect all areas of the South Bay to reflect declining median prices before the end of the year. While prices will be down on both a month-to-month and year-to-year basis, we don’t anticipate the median to fall below 2019 price points this year.

Total South Bay Sales Dollars

When the number of sales is decreasing and the median price of those sales is also decreasing, one has to assume the gross revenue will also decrease. Governor Newsome has been warning for several weeks that the 2022-23 fiscal year will not see the State level revenue surpluses California has been enjoying.

During the first quarter of 2022 gross revenue from real estate sales remained predominately positive, with year-over-year growth rates of about 6% per month. Since March the South Bay has only seen two instances of sales growth, 7% in the Harbor area for April and 3% in the Inland area for June. Every other entry on the chart is negative, with September declines averaging about 40%.

Cumulative sales for the first three quarters of 2022 were off by 29% compared to 2021. Our monthly sales dollars chart shows a zig-zag downward trend since spring of this year. Of course, 2019 is a more realistic point of comparison as a result of market gyrations created by the pandemic and our government’s fiscal response.

Comparing 2022 sales totals to 2019 yields a clearer picture of the current direction of the market. Instead of a sea of red ink, we can clearly see that 2022 sales have remained above those of 2019 with the exception of August. Sales started normally, then in March the Federal Reserve Bank announced a .25% interest rate hike, and promised more to come.

Buyers threatened with increasing monthly payments jumped into the fray and pumped sales up for a couple months. Then a new .5% increase, accompanied with the promise of multiple .75% increases throughout the year began a downward slide in home sales that is continuing.

Following the trajectory of the maroon line, and assuming the interest rates continue to increase, we predict 2022 sales will drop below 2019 again in October. The Federal Reserve Bank has already announced plans for another .75% increase in November, followed by a .5% increase in December. Adding another 1.25% will bring the full increase for the year to 4%. We envision the fall in sales growing steeper, bringing total sales below that of 2019 for the final quarter of the year.

Statistical Summary

This would be the heart of the discussion if we were dealing with a normal fiscal environment. Here we could talk about month-to-month changes and changes from the same month last year to this year. Instead we’re faced with an unanticipated side effect of the pandemic—out-of-control inflation followed by a steep recession.


The areas are:
Beach: comprises the cities of El Segundo, Manhattan Beach, Hermosa Beach and Redondo Beach;
PV Hill: comprises the cities of Palos Verdes Estates, Rancho Palos Verdes, Rolling Hills and Rolling Hills Estates;
Harbor: comprises the cities of San Pedro, Long Beach, Wilmington, Harbor City and Carson;
Inland: comprises the cities of Torrance, Gardena and Lomita.

Goodbye Marymount, Hello UCLA!

Marymount California University, is no more. But, shed no tears! The prestigious University of California at Los Angeles plans to open the site for classes in the fall of 2023-24. Escrow had not yet closed as of this writing, but all appears to be moving forward at good speed.

We are told the finalists included four developers and three educational institutions. We’re pleased that UCLA was the successful bidder. We’ve heard some of their ideas and look forward to having them as neighbors.

However, we’re also interested in what kind of potential the developers saw in this deal. There’s a total of 11 acres already developed as residential and 24.5 acres developed as a campus. What would that have looked like if a residential developer purchased the site?

The 24.5 acres, some of it with gorgeous ocean views, is the jewel in the transaction. A little “back of the envelope” calculation says that using an average of 15,000 square feet per lot, Which is about the average in that neighborhood, one could build about 70 high end homes at the location. New construction on similar sites is selling for about $7.5M today, giving a value for the finished project of approximately $525M. Not bad for a land purchase of $80M, especially considering we haven’t started looking at the 11 acres.

There exist some legal complications in the 86 unit, 11 acre property. Deed restrictions purported to require the land to be used to house students. That can readily be accommodated by an educational institution, like UCLA. Developers on the other hand might have to pay some serious legal costs to do anything else with the land.

And it might have been worth the legal expense. A quick look at the apartment building market in the South Bay shows roughly comparable buildings selling for about $420K per unit. That would make 86 units worth about $36M, almost half the stated purchase price.

We’ll never know what might have been. The entire South Bay can look forward though, to an educational revival. A refreshed campus with UCLA’s academic resources and access to the university program at AltaSea and other port projects is a great starting ground.

Photo by D koi on Unsplash

South Bay Median Home Price Plummets

With four months left in a very chaotic real estate year, we want to take this opportunity to lay some ground work for understanding why the market has headed into a recession. And, to keep things on a positive note, we end with a couple of suggestions on how you might profit from this turn of events.

Some of the nation’s most respected analysts (including Ivy Zelman of Zelman & Associates and Mark Zandi of Moody’s Analytics) are predicting recessionary price drops ranging from 10-20% and lasting through the next two years. (Arguing that we’re only looking at a brief correction, pundits at Goldman Sachs and the Mortgage Bankers Association continue to predict single digit growth.) Meanwhile, here on the street, we’re watching prices drop across the board for the second month in a row.

In August we reported that median home prices across the Los Angeles South Bay fell from July, the prior month. Now looking at August sales we find all four areas of the South Bay showed declining median prices again. The month-over-month price drops ranged from 6% at the Beach to 25% in the Inland cities. (See bottom for description of areas.)

Underlining the month-to-month price slippage, three of the four areas also showed declining prices versus the same month last year. Only in the Harbor area are homes still selling for more than they did in 2021. Even there, median price has slid from 9% down to 4% above August of 2021.

2022 Compared to “Normal” Business in 2019

The past two years have seen real estate stumble with the Covid lockdowns in 2020, then skyrocket with the low interest rates in 2021. It’s worth a look back to 2019 to see how the current conditions compare to the most recent “normal” market.

Looking at sales volume in the period January through August of 2019, 1064 homes had sold in the Beach cities. So far this year only 905 homes have sold. That is a 15% drop in sales since the last normal year of business. The trend line for the Beach area has been sliding downward since April.

For the first eight months of 2019 the Harbor area showed sales of 2955 compared to 2945 for this year. That is a drop of .3% – a statistically insignificant change. However, the trend line has been dropping since March. August sales were up slightly from July, which was an unusually slow month for the Harbor area. We expect sales to continue a downward trajectory into 2023.

Palos Verdes home sales for the same period in 2019 totaled 537 versus 568 in 2022. The Hill is the only part of the South Bay where year to date 2022 sales exceed those of 2019. At 6% it’s a healthy increase, too. Despite being the best performing area in South Bay, Palos Verdes sales volume peaked in March and continues to slide. Sales in July were unusually weak, so August shows an upward step in the trend line.

Sales in the Inland area, very much like the Harbor area are down only .4% from 2019 sales for the same period. The difference is statistically insignificant, and the trend line is headed downward.

Declining sales volume creates a larger inventory of homes to sell. As the inventory grows, sellers have more competition and buyers become more demanding and prices start declining. We anticipate continuing growth of available inventory, followed in late fall or early winter by a spate a price drops.

Median Price Up 54% Since 2019

Palos Verdes homes have seen the greatest impact of the Covid-era buying mania. Comparing median prices from the first eight months of 2019 to the first eight of 2022, we find a 54% escalation on the Hill. Normal growth over a three year period would have created 9-10% in price appreciation. Expect much of that excessive price expansion to be erased over the coming months.

Compared to 2019, Beach area median prices have shot up by 32%. This is easily three times normal growth. As we see in the chart below prices started adjusting downward as early as May in the Beach cities.

Since 2019 median prices for the Inland area have climbed 30%. Here in the August 2022 chart below we see Inland area prices have been dropping steadily since May when the median was $910K. During that four month period values have slipped by over $50K.

In the Harbor area home prices have escalated 34%. From 2019 at $565K to 2020 at $607K the Harbor area median grew $40k. Then in 2021, it added another $90K reaching $700K. So far in 2022 the median has reached as high as $830K – another $130K increase, but has now dropped back to $725K, losing $105K off the June median.

Most home buyers are constrained by their income to a particular price range, and salaries have not increased at a rate even remotely similar to real estate prices. Recent studies have shown about 25% of potential buyers were priced out of the purchase market in California by the soaring Covid-era prices.

Interest Rate Shrinks Annual Sales Dollars

In total sales dollars for January through August of 2019, the South Bay weighed in with $5.3 billion. During the same period in 2020 the aggregate amount shrank back to $4.9 billion, followed in 2021 by an upward explosion to $7.9 billion. So far in 2022 the area has reached $6.9 billion.

Each time the Federal Reserve System (fed) increases the short term interest rate the pool of potential buyers shrinks again. As this is written, the Fed is preparing to increase the rate by at least .75% in mid-September and two more increases are anticipated by the end of 2022.

At the current rate of declining value, we estimate the 2022 annual sales value to be approximately $9.5 billion, a decrease of 27% from 2021. Remember that huge budget surplus California had last year? Do not anticipate another this year, and possibly not for a couple of years as the state works its way through this recession.

The Silver Lining in the Cloud

One theory of success in real estate is “Buy low, sell high.” Flippers subscribe to that concept, buying at the bottom, updating and selling at the top of the immediate market. Another theory, not as well supported, but statistically more profitable, is “Buy and Hold.” Buy a piece of property at the best price you can and use it or lease it but – never sell it.

A deep market adjustment doesn’t come very often, so when it does one should take maximum advantage. At the moment it appears there will be a heavy price contraction starting late this year. We’ll know better in late fall and early winter, but all indications today are that a wise property investor should be preparing to buy at the bottom of the market – soon. We constantly search the Southern California coast for outsstanding investment bargains. Tell us what you want to invest – we’ll tell you where to buy.

Methodology

For purposes of comparing homes in the LA South Bay, we have divided the South Bay into four areas. Each is composed of homes of roughly comparable style, geographically similar location and physical characteristics, as well as approximately similar demographic characteristics.

The areas are:
Beach: comprises the cities of El Segundo, Manhattan Beach, Hermosa Beach and Redondo Beach;
PV Hill: comprises the cities of Palos Verdes Estates, Rancho Palos Verdes, Rolling Hills and Rolling Hills Estates;
Harbor:. comprises the cities of San Pedro, Long Beach, Wilmington, Harbor City and Carson;
Inland: comprises the cities of Torrance, Gardena and Lomita.

Main Photo by Amelia Noyes on Unsplash

The Highest Crash Risk California Metros

The aftershocks of the Great Recession are already here. We’re currently in the midst of a second, undeclared recession, albeit a less severe one. The lower severity doesn’t necessarily mean lower impact, though. Government assistance is what pushed us through the Great Recession, and that’s unlikely to occur again.

A recession doesn’t have to mean a market crash, but it’s a very real possibility. Some areas are at higher risk of a crash than others. The highest risk metros are those with high loan-to-value ratios, home flipping, new residents, and rapid home price growth. In California, these metros are Riverside, Sacramento, Bakersfield, San Diego, Stockton, and Fresno. Those aren’t the only areas that may be affected, though. Market problems in any one area will also cascade to other regions.

Photo by Hans Isaacson on Unsplash

More: https://journal.firsttuesday.us/these-california-metros-risk-housing-crash-during-the-recession/85478/

Recession FAQs: Is Another on the Horizon?

It is currently believed by experts that the US is heading towards another recession. It’s not a guarantee, and it won’t be for around six months if it does happen. So what exactly is a recession, and why is another being predicted? Many people are only aware of a recession as being a period of economic struggle. But it has a technical definition, which is two consecutive quarters of shrinking GDP. GDP is definitely not the entirety of the economic picture, but the conditions for a recession almost certainly indicate job loss and lower wages. What’s being predicted is simply a prolonged reduction in overall consumption, and this is mostly because interest rates are going up.

The Fed is purposefully raising interest rates in an attempt to reduce inflation. But a reduction in inflation doesn’t necessarily translate to no recession. If interest rates rise too quickly, it could actually cause a recession during a period of high inflation, which is called stagflation. This is what happened in 1981. Currently, experts believe the Fed is increasing interest rates too quickly. And it’s possible that they shouldn’t increase the rates at all; the prospect of increasing rates to reduce inflation is based on the outdated concept that high inflation is triggered by high wages. It’s true that businesses often like to take advantage of increased wages by raising prices without a significant decrease in demand, but this is calculated corporate greed, not an economic law. Perpetuating this idea only further lines the pockets of the already wealthy.

Photo by Marc Schaefer on Unsplash

More: https://www.theguardian.com/commentisfree/2022/jun/16/is-the-us-heading-for-a-recession-heres-what-you-need-to-know

LA South Bay Real Estate: May 2022

Number of Homes Sold

The number of homes sold in the South Bay has declined from last month, and has declined from last year. The quantities are actually rather dramatic given that May is typically a time of increasing sales. The drops range from -7% to -17% lower than April sales of this year, and from -17% to -25% below May of last year.

With over half the year remaining, mortgage interest rates have doubled, currently sitting around 6%. The hike in interest rates has so far reduced the average buying power by about -25%. Coupled with home price increases estimated to have risen 38% since the start of the pandemic, the immediate future of real estate looks dismal.

202205_sales_vol_chart

Inflated consumer prices are also blocking potential home buyers as the Consumer Price Index (CPI) climbs toward a 10% annual hike. There’s little chance of saving for a down payment when the price of everything on the shopping list is going up..

Retirement accounts are often a source of down payment funds. As of this writing the major stock market indices are all down: Dow Jones Industrial Average, -16%; S&P 500, -22%; Nasdaq Composite, -31%. Forecasts are growing for a Fed-induced recession that may begin as soon as this fall. Some potential buyers may see borrowing from their retirement fund to purchase a property as a means to preserve the capital during a recession. Others may not be in a position to do that.

Median Price Sold

May prices delivered a mixed message. The Palos Verdes Peninsula, which had seen two months of decline from a temporarily high median price, headed back up again. The Beach cities continued a steady climb, and the Inland area showed a modest price increase after having dropped 1% in April.

However, the Harbor area, which is as large as the other three areas combined, took a -6% hit to prices. We anticipate the Harbor and Inland areas, which comprise the bulk of the traditional middle class family homes in South Bay, to be the first to react to the economic stress.

Typically, the recession cycle starts with a slowing of sales. As properties languish on the market, sellers begin to reduce prices. One after another, median sales prices will drop until the price reduction offsets the impact to buyers. At that point, buyers will begin to support the reduced purchase prices and we can see growth in the market.

Experts differ in their estimates of how long this cycle will take, and when we can expect the market bottom. There are some predicting a rapid fall based on the speed with which the Federal Reserve Bank (Fed) is reacting. The June meeting of the Fed ended with a .75% hike in the prime rate, and a promise to raise it at least another .75% before the end of the year. While that could slow the economy as early as the beginning of 2023, more conservative minds suggest the end of 2023 for a turn-around.

Area Sales Dollars

The total sales dollars tell the truest story. While sales are slowing and median prices are beginning to slow, the combination shows up here.

Everywhere except the Beach is showing reductions in total sales on a month to month basis, and on a year over year basis. The declines are small to date, with year over year ranging from -1% to -10% in May. Month to month changes ranged from +2% at the Beach to -19% in the Harbor area.

202205_monthly_sales_$_chart

These early numbers follow the general pattern we’ve seen in recent recessions, whereby entry level homes are the first impacted and the last to recover. We anticipate the Harbor area to lead the charge down, followed by the Inland area. Recent years have shown the Beach to be the strongest growth area, so we expect the recession to hit there last, following declines on the Hill.

The nature of the impending recession is still uncertain. Some pundits are saying that at least initially we should expect “stagflation,” that odd environment we first encountered back in the 1990s when prices of everything continued to climb, along with job layoffs and massive unemployment. Other forecasters suggest that because the international economy is roiling with continuing high tariffs (courtesy of the last administration) and new monetary sanctions daily (courtesy of the current administration), this particular recession may last much longer than normal.

In Summary

As the table below shows, the majority of the negative impact for May happened in the quantity of housing units sold. With one exception, prices continued to escalate. We believe this is temporary and likely to change before the end of the year. The -6% drop in median price at the Harbor presages the direction of home pricing as inventory grows and listings stagnate.

Approximately 3 out of 4 listings coming across our desk recently have been either Price Reduction or Back On Market. That means property is staying on the market longer. The Average Days On Market (DOM) for May ranged from 10 days on the PV Hill to 14 days in the Harbor area. As recently as this winter we were still seeing multiple offers on the first day the property was available.

Another measure of the market condition is how far the average sales price declines in the first 30 days on market. We did a quick look for May and came up with these statistics. Thirty days after the original listing, the price had dropped from the original: at the Beach, -9%; the Harbor -6%; PV Hill -18%; Inland -5%. As of May, we’re also seeing property that has been on the market for several months, with several price reductions.

Notable Properties

The high and low sales for May were not terribly dramatic. A Manhattan Hill section home and a downtown Long Beach condominium. Thay are simply very big, and very small.

High Sale

Located at 812 5th St, this Manhattan Beach hill section home was originally listed at $10.5M and sold for $8,980,000 after 34 days active on the market. The home offers six bedrooms and seven full bathrooms in 5576 sq ft. Amenities included ocean view, pool, spa, custom waterfall & fire features, a full basement with recreation/media room, home theater, storage, a temperature-controlled wine cellar, and private guest quarters.

Low Sale

Measuring barely 381 sq ft, the studio condo at 819 E 4th St #25 sold for $215,000 in one day. Located in the vibrant East Village of Downtown Long Beach this tiny home offers a remodelled kitchen and bathroom. The unit sits on the second floor, overlooking the intersection of 4th and Alimitos and within walking distance of many downtown shops, clubs and eateries.

Main photo by Kostiantyn Li on Unsplash

Expected Price Drop May Cause Double-Dip Recession

While we can all agree that high prices and low inventory is not a recipe for a healthy real estate market, reversing the trend too quickly can cause issues as well. Prices are predicted to start declining towards the end of 2022 and throughout 2023 and 2024. This may be good for prospective homebuyers, but it’s not good for sellers who purchased relatively recently.

A sharp decline in prices could result in negative equity for some people looking to sell, meaning that they won’t be able to sell normally and may have to go into foreclosure. This is not the same type of recession that we’ve just experienced, but it’s a recession nonetheless. Fortunately, it’s not likely to result in a crash, since the continued low inventory is a positive for sellers. The market is expected to begin to stabilize in 2025, but not without steep economic losses.

Photo by John Fornander on Unsplash

More: https://journal.firsttuesday.us/how-to-prepare-for-the-reo-resurgence/83443/

LA South Bay Real Estate: The Recession Has Arrived

In a normal year one would expect April to be the turning point for the LA real estate market. March is still cold and the children are still in school for another 10 weeks. April’s the month when the weather turns warm, the flower buds poke up, and the buyers come out to start the spring buying season. It hasn’t happened that way this year.

Prices had gone through the ceiling by the end of 2021, much of the activity stimulated by fear of escalating mortgage interest rates. Usher in 2022–January and February were typically slow and in March home sales bounced up like an indicator of business as usual. But, interest rates continued to climb and April ended with the total number of home sales down instead of up. Likewise, total sales dollars were down across the South Bay.

Number of Homes Sold

Judging from the charts, entry level homes in the Harbor area were clearly the center of activity for South Bay real estate. As interest rates pushed against the 5% mark, panic set in among first time buyers who had been outbid multiple times. Prices went up as high as buyers could afford, a number that shrinks amazingly fast with each tenth of a percent increase in the interest rate.

Across the South Bay, the number of homes sold in April dropped by -4% from March, which had been an increase of 59% over the prior month. As we see from the chart below, sales were uneven between the various areas.

On the entry level front, at the same time Harbor area home sales were dropping off, Inland homes gained sales. On the high end, sales on the Palos Verdes peninsula were also facing declining numbers, while Beach area sales increased.

So far declining sales counts have been modest, but a decline overall, coupled with a decline in half of the individual areas covered indicates that buyers are pulling back. Part of the resistance is a matter of simply being priced out of the market. Another important piece is the anticipation of price corrections in the near future. We have heard multiple buyers say they are watching and waiting for lower prices later this year.

At this point we’re well into the second quarter of the year and it looks as though those folks may be on track for some savings. even some of our most gung-ho pundits are beginning to see a market downturn on the horizon.

Median Price Sold

Interestingly, Harbor area prices went up at the same time the number of sales went down.The March to April price increase was a modest +6% compared to a +21% increase over April of last year. Similarly, the Beach cities had a month over month increase of +4%, while showing +19% year over year. While sales prices are still rising in those areas, the increase is a fraction of what it was last year.

Sold prices on the Hill continued to slide downwards. Because the February increase in the median price was created by the sale of new construction, and that building phase is now sold out, a downward turn in median price is expected. We anticipate that leveling off soon.

In the Inland area the median price for homes sold during April of 2022, was +12% greater than sales in April of 2021. By comparison, the median price of those sold in March of 2022 versus April of 2022 decreased by -1%. It’s a modest decrease that points to the direction of the South Bay real estate market for the balance of the year.

Area Sales Dollars

The total dollar value of home sales in the South Bay usually tracks right along with the number of units sold. The few times it differs are important times like these when the number of homes sold is dropping, and/or the sales prices are dropping. Today, of the four areas we track, PV Hill has a declining number of sales, both in comparison to last year and in comparison to last month. As we noted above, the area also is declining in total dollars compared to last year and last month.

As we discussed in last month’s issue, some of the reason for the drop is found in new construction homes that sold at a much higher price than the typical Palos Verdes resale home. The rest of it can be found in longer days on market waiting for a buyer, and in price reductions.

At the opposite end of the spectrum, the Beach cities showed gains last month for both number of units sold and for the total sales value of those homes. The only decline this month for the Beach was in number sold compared to April of last year. Sales this April were off by -21%.

The Harbor area still trended upward in dollar value, both month over month and year over year. But, the number of units sold was down for both time measurements. The price competition was very stiff in what is generally an entry level market. During the past couple years, bidding wars and over-asking sales prices have kept the dollars high. The April numbers show that changing rapidly.

Total dollar sales for the Inland community increased 15% month over month. That was the highest growth of all four areas. Scanning those individual transactions showed an odd pattern. Sales in the price range from about $325K up to about $750K were a familiar mix of some under asking price, some at asking and some above asking. The degree of variance was about what one would expect. Unexpectedly, for sales over $750K, nearly every property sold above asking price, and in many cases well above asking.

We found no clear explanation for why this phenomena occurred. There is a suspicion that buyers who were priced out of Beach properties may have shifted their bidding wars into the increasingly popular parts of west Torrance. This theory is supported by the distribution of sales among the various neighborhoods.

In Summary

In the table below are the core statistics comparing April to March of this year, and comparing April of this year to April of 2021. The prevalence of negative numbers is convincing evidence that high prices and high interest rates are pushing the South Bay real estate market into a recession.

Notable Properties

One of the more interesting properties sold in April is a four bedroom, five bathroom home located in west Torrance. The home was purchased by the seller as their family home in 1990 for just above $360K. The children grew up and the parents remodeled in 2022 and sold the house.

As would be expected in a good neighborhood with a contemporary remodel, the home sold for over the asking price of $2.7M. The final selling price was slightly over $3M. and just happened to be almost exactly $360K over the asking price.

In the 32 years that family owned the home it appreciated at an average rate in excess of $84K per year. It’s the classic “American Dream.”

Main photo by Amy Vosters on Unsplash