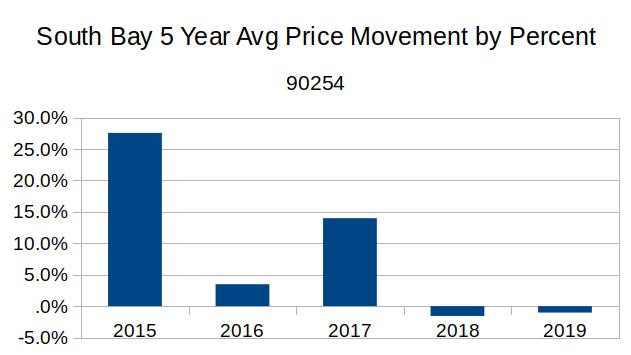
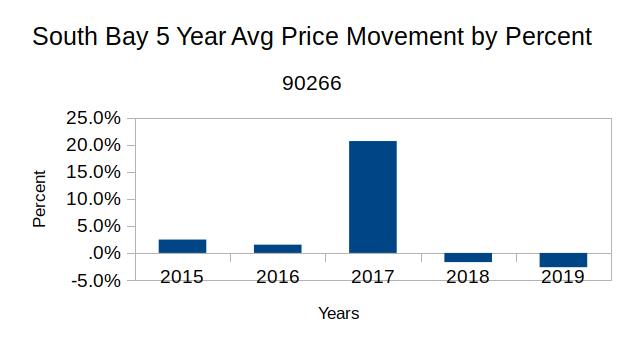
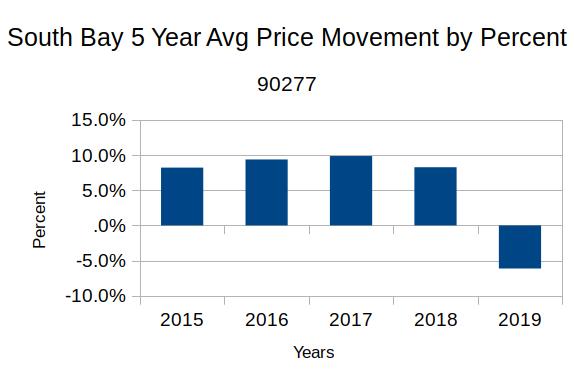
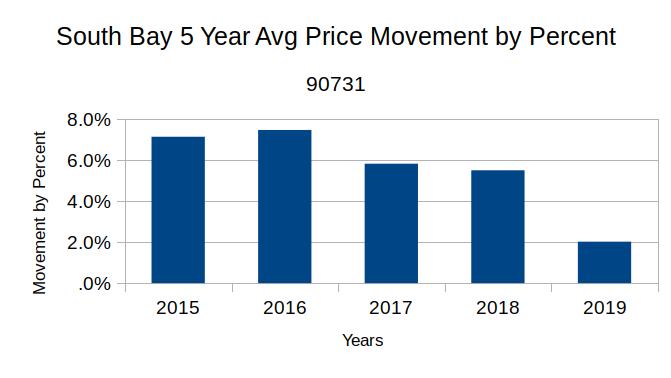
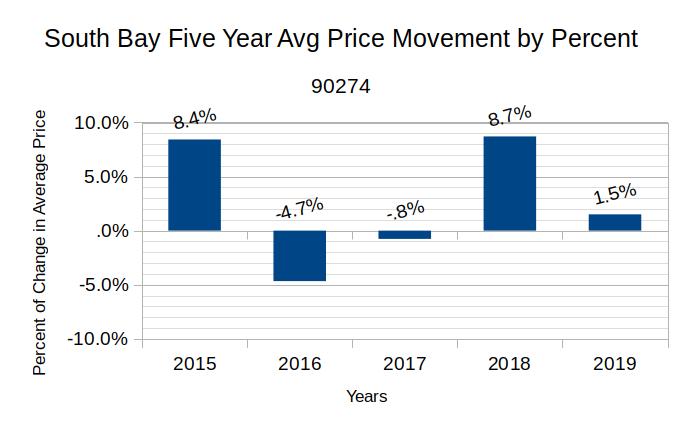
South Bay median home prices are continuing to climb! May versus April showed increases as high as 9% for the month. Comparing May of this year to last May gave increases as high as 18% for the year. Year to date statistics for the first five months of the year came in with increases as high as 11%. Looking at the same five month period from five years ago shows median prices have climbed by nearly 45%.
Mortgage interest rates have roughly doubled from two years ago. The Federal Reserve Bank kept raising rates, hoping to drive inflation down. Unfortunately, it doesn’t seem to be working in the real estate world.
So far this year the interest rate increases have only modestly slowed purchases in month to month data. The number of homes sold in April was 10% higher than in March. May shows a 2% increase in the number of homes sold compared to April. Year over year sales volume shows a greater impact, with an 8% drop from May of 2023 to May this year. Most of that decline was lost this year as home sales for the year to date are up 1% from last year.
Once again looking back five years shows sales are off by 22% across the board from pre-pandemic sales volume. All while median prices are up 45%! But, there are very few homes on the market, and the shortage of inventory is driving price increases, contrary to the Fed goal of slowing inflation.

So why are there so few homes for sale today compared to 2019? And why are prices climbing in the face of mortgage interest rates that have doubled?
One possible factor: During the pandemic mortgage interest rates were at and below 3%. A significant number of existing mortgages were refinanced during the 18 months of the pandemic. Another 17% of currently existing mortgages were purchases at those rates. In summary, about 50% of the current mortgage market is now holding a note with an interest rate that is a fraction of today’s rates. There is essentially no reason for those folks to ever move.
Since about 80% of California homeowners carry a mortgage, and about half of those have an historically low interest rate, about 40% of homeowners have an incentive to stay where they are now, rather than trade up, as would be normal. Given the financial benefits, those homeowners are not likely to put their home on the market and increase the inventory thereby relieving some of the supply and demand imbalance.
Forty percent is a huge piece of the available housing stock to be removed from the market in a time of a housing shortage. Work-related re-locations would have once smoothed this out, but the “work from home” movement has also contributing to the slowing real estate market. The current outlook is for several years of low inventory, further exacerbating the increase in housing costs.
Eventually the inflation of housing prices will come under control and annual increases will get down to something less than 6%. There’ll be no attempt to “dial back” the inflation and return to a prior point in time. So the short term question is, “How do we adjust to the new reality of higher prices, fewer homeowners, and more renters?”
Beach: Anticipate Fewer Sales & Higher Prices
Monthly statistics have been misleading in recent months in all the areas. May activity at the Beach is a great example of the disparities. Compared to April, 7% fewer homes were sold in May with no change in the median price. Contrast that with the annual numbers where sales in May of this year are down 9% from 2023 but the median prices are up 9%.
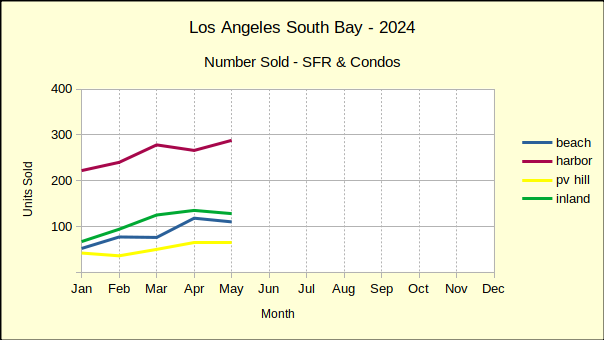
By looking at data for the year to date, the sporadic ups and downs can be smoothed a bit. This shows a more complete picture of what the market is doing in comparison to last year. In summary, the first five months of the year show a 10% growth in sales for the Beach cities, accompanied by a 6% increase in the median price.
Early projections for June indicate an annual decline from the same month last year sales of over 15% and a price increase of nearly 20% in the Beach area. If these preliminary estimates hold true, there will be some serious hand-wringing among the financial community.
Harbor: More of the Same
Like the Beach area, month to month statistics for the Harbor area have been very volatile this year. The number of sales in May climbed 8%, after falling 4% in April. May’s median price was up 9% following a 1% increase for April.
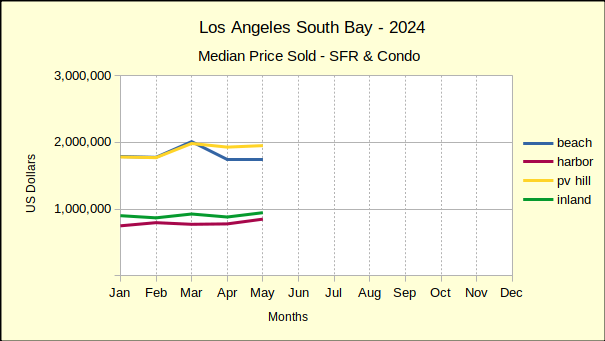
Year over year, sales volume was down 15% compared to May of last year, while the median price jumped 18%. This follows the general trend of declining sales and increasing prices. Theoretically, the declining sales will induce sellers to reduce their asking price, which will then translate to a reduction in the current inflation rate.
With the year to date sales volume dropping by 5% the interest rate increases would appear to be working. But the increase in median price by 8% for the first five months of 2024 throws cold water on the idea that inflation in real estate is going away.
More of the same is projected for June with a drop of 15% in sales and an increase of 5.5% in median price.
Hill: Sales Volume and Median Prices Up
Only 66 homes sold on the PV peninsula in May, compared to 64 in April, so the 3% increase in sales volume is not terribly consequential. Likewise the 1% growth in median price from $1.93M to $1.95M.
As mentioned in previous articles, activity levels on the Hill are small, so it only takes a minor change to look statistically important. For example, 65 home sales in May of 2023 versus 66 in May of 2024 is only one more home sold, but represents a 2% growth in volume. Even more so, the $2.3M median price from May of 2023, which is an exceptionally high monthly median price in PV under any circumstances, makes the 15% decline to $1.95M look huge in 2024.
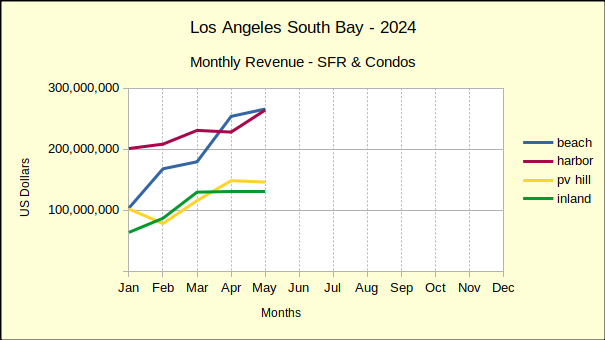
In reality, the May median price is actually higher than the year to date median of $1.93M and higher than all but the March median of $1.98M. January through May sales volume is up 4% and the median price is up 11%, very much like the rest of the South Bay.
June sales are projected to decline slightly with a modestly elevated median price.
Inland: Sales Up and Prices Up
From April to May the number of homes sold in the Inland area declined by 5%, much as the Beach area sales volume transacted. Unlike the Beach and PV, where median prices ended barely positive, the median increased by 7% in the Inland area. That hefty increase mirrored the Harbor area lift of 9% month over month in the median price.
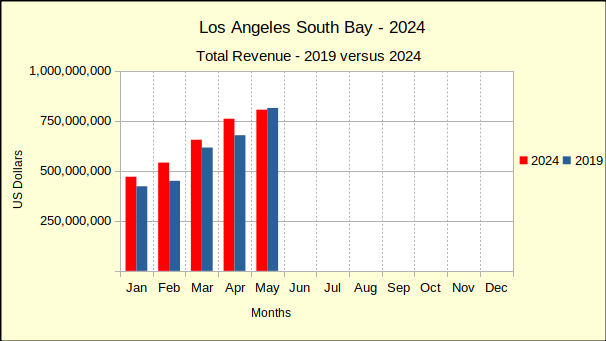
A 6% increase in the volume of homes sold and a 7% rise in the median price from May of 2023 to this May deviated from the other areas. It displayed a stronger than expected sales volume, especially considering the Beach and Harbor areas were deeply negative. At the same time the median price showed a slower increase than either the Beach or the Harbor.
Year to date for the first five months of 2024, the Inland area showed an increase of 8% in the number of homes sold, and a solid 6% increase in the median price. All in all, an investment in one of the inland cities would have been a good performer in May.
That investment is projected to still be sound in June, with a small decrease in the number of homes sold and a similar increase in the median price.
Beach=Manhattan Beach, Hermosa Beach, Redondo Beach, El Segundo
Harbor=Carson, Long Beach, San Pedro, Wilmington, Harbor City
PV Hill=Palos Verdes Estates, Rancho Palos Verdes, Rolling Hills, Rolling Hills Estates
Inland=Torrance, Lomita, Gardena


