SYNCOPATHS “BE LIKE THE SEA” CD RELEASE CONCERT Saturday, June 17 / 8PM at the Grand Annex Music Hall
Celebrate the Syncopaths release of their new CD! “Be Like the Sea” delivers a wide variety of songs and tunes from the Irish, Scottish, and American traditions, as well as original compositions. It’s sure to be a joyous night of contemporary folk music featuring vocalist Christa Burch, Ryan McKasson, Ashley Hoyer and Jeffrey Spero this Saturday night at the Annex.
This is a once a month (every third Tuesday) show that is designed as a listening room for world class songwriters, to play their original music in an intimate setting. The music starts promptly at 7PM. No cover charge, but donations to the performers is encouraged. This month the performers include: JODI SIEGEL, T BEAR, BECCA BYRAM, ALFRED JOHNSON.
JODI SIEGEL
Jodi Siegel, originally from Chicago, IL, is a singer, songwriter and guitarist. Over the years Jodi has opened for and or shared the stage with many respected musicians including: Albert King, Robben Ford, Robert Cray, J.D. Souther, David Lindley, Fred Tacket and Paul Barrere (Little Feat) and countless others. Her songs have been recorded by Maria Muldaur, Marcia Ball, Tommy Ridgley and Teresa James. Her latest CD, “Wild Hearts,” produced by Steve Postell, is filled with great songs, cool grooves, intimate, smart lyrics and some of the best of the best musicians in Los Angeles today. Each song has a soulful delivery with an undeniable down-home elegance. It has received great reviews by Patrick Simmons (Doobie Brothers), Maria Muldaur, Walter Trout, David Mansfield (T Bone Burnett), Leland Sklar, Mike Finnigan and Doug Macleod to name a few.
ALFRED JOHNSON
The highly regarded singer/songwriter and funk piano player, Alfred Johnson is considered by some one of this century’s most animated and original songwriters. His energetic style of playing the keys brings a wonderful compliment to his music. Alfred co-wrote 3 songs with RICKIE LEE JONES, including the musical masterpiece “COMPANY,” which are all featured on her 1979 Platinum Grammy Award winning premiere album containing the hit single “Chuck E’s In Love”. Recognized as a true craftsman of his art, Alfred has written over 900 tunes, and at least 70 of them are published. He is best known for his lyric-driven tunes that will keep you captivated till the end. Alfred’s diverse musical style encompasses Funk, New Orleans, Pop, Rock ‘n’ Soul, Gospel, “Rhythm & Bluegrass” – as he calls it, and music that will have you wanting to dance and sing along. He enjoys sharing his work with good listeners.
T BEAR
T Bear, aka Richard T. Bear, is no stranger to musicians and fans all over the world. He has been a long time touring and recording session man and artist, and considered to be one of the best singer/songwriter/keyboard players in Los Angeles. He has returned to the stage with a striking new release, Fresh Bear Tracks, his first studio album in 25+ years. He’s re-emerged, feeling newly inspired, creatively recharged, and making some of the most engaging music of his career. A distinctive singer and talented keyboard player who made his mark as a solo performer and collaborator with many iconic artists — Crosby Stills and Nash, The Blues Brothers, Billy Squier, Cher, as well as Gene Simmons and Peter Criss of Kiss, to name a few — he’s now taking center stage and ready to share his newest music with the world. Fresh Bear Tracks features a host of special guests, including Stephen Stills, Robby Krieger, Edgar Winter, Tom Scott, Walter Trout, and Hutch Hutchinson,
BECCA BYRAM
Originally from England, Becca moved to the US early in her career, securing work as a session musician and songwriter in New York, developing a reputation as a highly regarded analog keyboard player and vocalist, and became a resident player at the world renowned Hit Factory after catching the ear of Eddie Germano. She signed with Caroline Records after Bill Laswell was swept away by her talent and her debut album, “Becca’s Smoke and Candy Store” was released. On the heels of that, she published a healthy catalogue of further recordings including “Nice to Be There, “ Childhood’s End,” “A Fair Forgery” and two live albums, “Live from CBGB’s” and “Live from the Living Room.”
Project Barley serves excellent Food (Gourmet Pizza, gluten free/vegan options, wings, sandwiches, salads), wine, and award winning beer. Food served till 8:30pm. No reservations so arrive early to get a table. 2308 E Pacific Coast Hwy, Lomita, CA 90717 https://projectbarley.com/
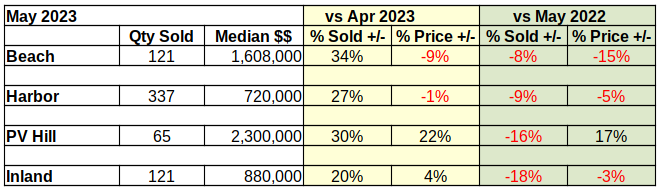
Compared to last month, South Bay home sales look very positive, except for a little tarnish in the Beach cities prices. The sales volume was up by substantial margins in all areas. Prices were mixed with a remarkable median price increase on the Hill. The only exception: After showing positive growth for the past two months, prices at the Beach took a substantial tumble in May.
Year over year activity was an entirely different story. Sales volume was down significantly from last year in all areas. Prices took a hit everywhere except on the Palos Verdes peninsula. (More about that below.) Entry level homes in the Harbor and Inland areas were impacted the least, though even a 3% drop in a single month is significant in the world of real estate.
We report actual statistics rather than “seasonally adjusted”.numbers. May is traditionally the launch into buying season in the South Bay, so a May increase in volume from April is to be expected. On the other hand, a 10-20% decrease from May of last year indicates a heavily retrenching market. Every month since the beginning of this year, the number of homes sold in the South Bay has decreased in comparison to 2022.
Similarly, median prices across the South Bay have dropped from the highs of 2022. There have been scattered instances of positive change, like the 17% increase over May of last year for PV. Overall though, prices have been collapsing at an ever more steeply declining rate since January.
Much has been said about the steep rises and falls of sales volumes and median prices since the Covid pandemic hit in early 2020. That leaves 2019 as the last “normal” year of business. At the mid-year point we’ll give a more in depth comparison to 2023 to hopefully provide a more stable picture of the market. In the meantime, year to date statistics for the first five months reflect an overall decline of 23% in sales volume, and an increase of 33% in median price. The sales slowdown has most affected the Beach Cities with a drop of 39%, followed by the Inland area at 21%, the harbor at 19%, and finally the PV Hill with a 14% slip. A review of the changing median prices across that many years requires adjusting for desired inflation as opposed to uncontrolled inflation.
Beach Cities: More Sold at Lower Prices
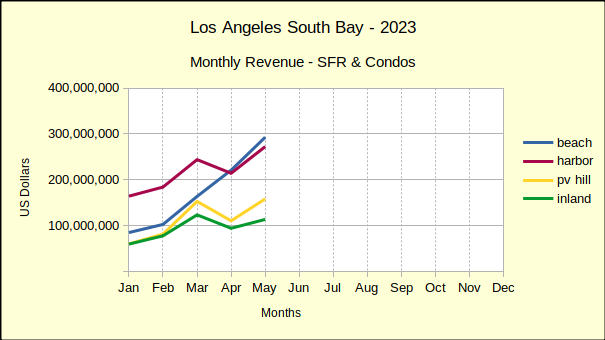
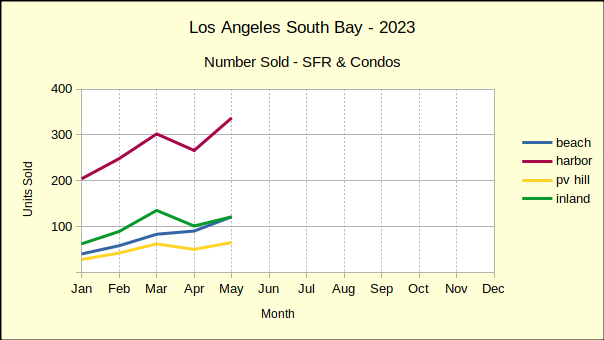
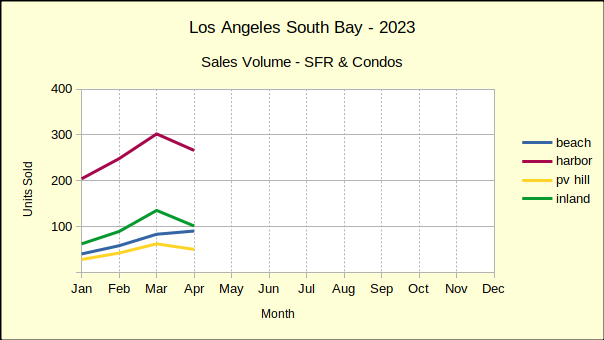
Monthly, the Beach Cities have been on a roll. Even in April, when the other three areas took a nose-dive, the Beach climbed steadily higher in both sales volume and median price. The blue line on the monthly revenue chart below shows surprisingly strong growth.
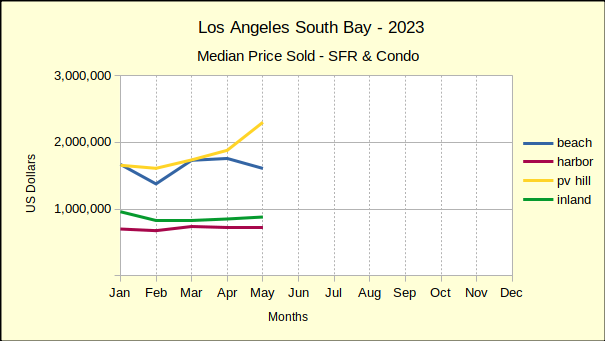
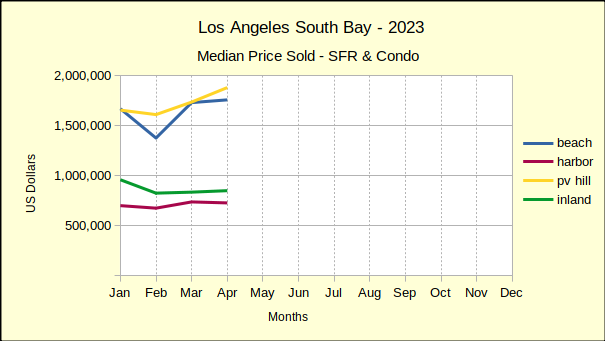
A closer look at the sales data shows some of the detail. Two of the 121 Beach area sales were on the Strand, with one selling at $18.6M and the other at over $15M. Sales in that rarefied atmosphere tend to be few and far between. In fact, one of those properties sat on the Multiple Listing Service (MLS) for almost exactly three years before it sold. With the April median price at $1.6M, the impact to the aggregate statistics becomes apparent quickly.
Market time for the Beach Cities in May was actually quite prompt, with 79% of the homes sold having spent less that 30 days on the MLS. Pricing was equally strong, with sales prices coming in at two percent above asking price. While the high sale was $18.6M on the Strand, the low was $530K at Brookside Village in Redondo Beach.
Harbor Area: Sales Up – Prices Down
As the red line in the chart below reflects, Harbor area sales entered the spring selling period with a bang! Sales volume was up 27% over April—but, remember April sales were down by 12% in the Harbor and down 13% across the South Bay. Downward pressure on prices has been showing up since the beginning of the year. Out of the first five months of 2023, month to month median prices of Harbor area homes have dropped three times. May saw a 1% decline, which was a repeat of April’s price slip.
Annual statistics cast a recessionary shadow across the picture. Looking back at May of 2022 shows the same month this year with 9% fewer sales and a drop of 5% in median price. Year to date, 2023 has lost 29% in sales volume and 5% in median price.
Compared to the first five months of 2019, the last “normal” business year, Harbor area volume was off 19%. The median price remains positive at 33% above the 2019 median. So far this year the median at the Harbor has declined an average of 5% per month. Given that rate, it’s reasonable to expect a total loss of the price gains since 2019.
Like the rest of the South Bay, the time on market for May was short as 75% of sold properties went into escrow within 30 days of listing. The low sale for the month was $269,500 and the high was $4M, a relatively high price in what is generally considered an entry level market. Interestingly, the high sale was originally listed at $9M in March of 2021, sitting on the market for two years before an accepted offer.
Palos Verdes: Home Sales & Prices Hot On The Hill
On a month to month basis, homes on the Hill came in with a 22% increase in median price, that being on top of back to back 8% increases for March and April. We’ve long said that homes on the Hill are undervalued. It looks as though that will soon be changed.
Monthly sales volume also jumped 30% for PV, though it has slowed since February and March when it was up 50% and 48% respectively. This pattern of sales increases slowing holds true for most of the South Bay. During the first quarter of 2022 the local real estate market was on fire, and then came the interest rate increases.
When the interest rates were bouncing around 5% during April and May of last year, the PV sales volume had already begun a long, slow decline. Sales figures were off by 30%-40%. So far this year, sales have continued to fall and are, in aggregate, now 31% below 2022 volumes.
Again on a year to date basis, median prices in PV are down 11%. Because the PV Hill has a comparatively small amount of homes, statistics can be volatile. June was the peak of PV business in 2022. While the summer months are typically busier and more competitive, expect this June to be less “exuberant” than May, or last June.
Like the rest of the South Bay, about 75% of homes sold on the Palos Verdes peninsula were active on the market for 30 days or less. On average, the sales price was 2.6% above the asking price.
Inland Area: Seasonal Bump In Sales and Prices
In May, the Inland area kicked off the spring selling season by pushing month to month sales volume upward 20%. While the volume of sales increased on a month to month basis, the median price went up by 4%. This seasonal bump in sales and prices contrasts sharply with the longer look of a year over year view. Comparing May numbers from last year to this year gives a reverse result. The number of homes sold in the Inland area fell 18% from May of 2022, and the median price fell 3%, dropping back to $880K from $910K last year.. The longer perspective shows a clear decline in sales accompanied by a hint of decline in median prices.
Looking at the first five months of the year shows sales volume off in total by 68%, or an average monthly decline of nearly 15%, another indicator of the slow market. It’s joined by a 1% drop in the year to date median price. On the positive side, 87% of the Inland area sales for May closed within 30 days of being listed. With business slip-sliding away, everyone involved is making the transactions happen as quickly and smoothly as possible. The high and the low sales figures for the Month were $1.7M and $310K, respectively. Sellers rejoiced at, and willing buyers paid, an average sales price of 2.9% above the asking price.
Did you graduate from college recently, or do you know someone who has? Looking for a city with good employment opportunities? So are most other recent college graduates. In order to determine the ideal cities for this segment of the population, Zillow has analyzed many US cities looking at four factors: rent-to-income ratio, average salary for recent college graduates, job openings, and share of population in their 20s. They’ve found that the top ten cities for recent grads are Colorado Springs, CO; Spokane, WA; Des Moines, IA; Phoenix, AZ; Buffalo, AZ; Albuquerque, NM; Bakersfield, CA; Albany, NY; Portland, OR; and Little Rock, AR.
Of course, this analysis isn’t an exact science, so you should take it with a grain of salt. There are far more cities in the US than Zillow could ever hope to analyze, so they’re only looking at the largest metros. Their analysis also only looks at rentals, not purchases. While this may simply be a realistic approach, it actually doesn’t bode well for recent grads if renting is their best option — especially in a rather inexpensive place like Little Rock. Job openings also may not be the best statistic to look at, since the jobs may be open because they simply aren’t good jobs.
Purchasing a home is a tough decision. You’re probably going to live there around eight to ten years, on average, so you want to make sure it’s somewhere you want to live. The good thing about building new is that you can make sure the home itself is right for you. But it’s really not that simple. There are pros and cons to both buying and building.
The most obvious advantage to buying an existing home is the reduced hassle. You don’t need to oversee the design and construction, making sure everything is to your specifications. You don’t need to wait for construction to finish before moving in, and while delays are still possible, there are fewer opportunities for delays. Another is that purchasing a home may be less expensive. This depends on the area, but construction costs are still high. Moreover, existing homes have almost immediate resale value, which can mean greater equity when you go to sell it. A less apparent advantage of buying an existing home is location. You might imagine that when you’re building new, you can pick anywhere to build as well, but the fact of the matter is that there are far more existing homes than empty lots, so you don’t get as much choice of where to build unless you’re planning to bulldoze an existing home.
The primary benefit to building new is customization. Whether you’re buying or building, you should have a good idea of what you need or want in a home. By building new, you ensure that you get those things, as long as they’re within your budget and no complications occur. A new home also means fewer issues, at least once the construction is finished. Any major structural issues would be the fault of the builders and not age. The property will use the latest building technologies, which are generally safer and more energy efficient. Building new is also a safer investment, albeit not necessarily a highly profitable one. It may take longer for a newly constructed home to accrue equity, but it’s extremely unlikely to go negative by the time you sell.
There are certain factors that are always important when buying a home. Everyone knows to look within their budget and find a good location, even if they need the help of an agent to figure out what those are. The same is true of buying land for the construction of a new property; however, there are additional considerations that you need to keep in mind.
When you’re buying an existing property, you can be fairly certain that the property is located within the boundaries of the lot and the soil has suitable conditions for building. If either of these isn’t the case, you certainly should be notified. But if you’re buying land with the intent to build, you need to know the property lines, topography, and soil conditions before you can determine whether or not it’s the right lot for you. You should also make sure that any utilities you want are readily available. Not every home needs to have access to every utility, but if you want one that isn’t currently available, that could mean the lot isn’t right for you or may just require additional expenditures. Another factor is zoning. If a property exists there, the area is probably zoned for such a property, else it’s grandfathered in somehow, or there’s a chance some work was done on it without a permit. If there is no property, you need to know what types of properties can be legally built there.
If you’re having trouble balancing your budget, one possibility is that you haven’t considered exactly what your budget looks like. Of course, it may be that you’re having financial struggles that you can’t fix with simple budgeting, but you won’t truly know until you examine the numbers.
The first thing to do is assess all your current debts. This includes not just outstanding balances, but also interest payments and minimum monthly payments. Don’t just lump them all together, though — clearly delineate your debts and prioritize them by importance or due date. Next, look at all other expenses that aren’t categorized as debts. Categorize them by essential and nonessential expenses. If you’ve ever itemized on your tax return, you should be familiar with this, though the categories may differ. Then allocate funds as necessary to pay debts and essential expenses before looking at nonessential expenses. You should also set up an emergency fund and allocate funds for that.
Once you’ve allocated funds, if things don’t look good for you, consider the options to either fix the budget or reduce the negative impact of an imbalanced budget. If you can allocate enough funds for debts and essential payments, it could be as simple as choosing which nonessential expenses you’re willing to give up. Or maybe you actually have the money, and are just saving more than you need to. One way to reduce negative impact is by deciding how you want to prioritize debts. One option is to pay extra towards high-interest debts to keep the payments manageable. The other is to focus on the debts with the lowest balance to eventually eliminate them entirely. Sometimes these could be the same debt, which is great, but other times you’ll need to pick which is best for you. If just reprioritizing payments isn’t going to fix your budget, some possible options are negotiating with your creditors, consolidating debts, or refinancing at a lower interest rate.
Real estate listings are meant to draw people in. This inevitably results in vague wording to obscure potential issues, and over time agents have developed specific buzzwords for this purpose. This isn’t necessarily a malicious trick; it’s no different than any other attempt at salespersonship. Not all of these necessarily mean there’s something wrong with the property, but what it does mean is that you should be aware that you may not be getting what you expect.
Several of these attempt to put a positive or neutral spin on something that isn’t desirable. These include terms such as “vintage” or “old world charm” or even “comfy,” that often just mean it’s worn out and out of date. Phrases like “one of a kind” and “transports you” actually mean that there’s nothing compelling about the property, so no one wants to copy it and residents prefer to think about being elsewhere. A listing stating “backs up to a green belt” may be entirely truthful, but since a green belt just means construction is prohibited, there are a lot of things that are legally categorized as green belts that aren’t particularly green — like a section devoted to power lines. Similar is the term “updated,” which doesn’t necessarily imply the updates are recent. Other common adjectives are too vague or subjective to be meaningful: a neighborhood described as “vibrant,” “quiet,” or simply “good.”
California has a long list of protected classes under its fair housing laws. Landlords are forbidden from refusing tenants on the basis of being in a protected class. People with a criminal history, however, are not a protected class, and landlords are allowed to request a background check and base their decisions on it. So landlords may not be aware that it is illegal have a blanket ban on tenants with criminal history. Why is this the case, then? The answer is implicit discrimination.
It’s well known that racial minorities, particularly Blacks, are heavily disproportionately criminal record holders. Regardless of the reason for this fact, it’s true that blanket bans on criminal record holders do therefore disproportionately affect racial minorities. Because of this, California law prohibits these blanket bans. It is, of course, also illegal for landlords to only conduct background checks on members of specific protected classes, but this shouldn’t come as a surprise. In addition, landlords cannot reject tenants on the basis of suspected criminal activity without a criminal record, nor on the basis of gang affiliation. Despite the association of gang affiliation with probable criminal activity, it is not actually illegal to simply be a member of one.
Freelance workers and some self-employed people typically don’t have a consistent income. This leads some to doubt whether or not they qualify for a mortgage loan. Lenders will never blanket deny everyone with an irregular income, but it certainly could be more difficult to get a loan. As long as your credit history and debt-to-income ratio are good, it shouldn’t be too much of an issue — you simply may need more documentation to prove that you’re good for it. While lenders will always look at recent income, in the case of irregular income, they may also consider whether or not you’re likely to have clients in the near future based on your occupation.
If you get rejected outright, it’s likely that now isn’t a good time for you to buy in the first place. As long as you aren’t getting rejected, the worst case scenario is a non-qualified mortgage loan, or non-QM loan. Non-QM loans don’t meet the Consumer Financial Protection Bureau guidelines that are designed to ensure borrowers are able to repay their loans, and not all lenders offer them. They may be used for self-employed people, people with irregular income, people with low credit scores, or non-traditional types of properties. Because non-QM loans are riskier for the lender, they do have a drawback for the borrower. They typically have higher interest rates, larger down payment minimums, and/or shorter repayment periods.
It can be a difficult decision for a seller whether or not to write a counteroffer. In addition to there being two other options, accept the offer as is or reject it and wait for a better offer, the counteroffer has the potential to push away the buyer and possibly force you to wait for another offer. But this decision can be made easier by learning how to write a good counteroffer.
The worst thing you can do when making a counteroffer is not communicating. Usually this is done through agents and not directly with the buyer, but that’s better than nothing. Try to learn what the buyer’s goals and motivations are, and craft a counteroffer that provides what they want in exchange for something else that you want. A counteroffer that attempts to assert the seller’s position is a bad counteroffer. A counteroffer that recognizes what a fair deal is in the current market conditions is a good counteroffer. In addition, don’t try to confuse buyers into accepting a bad deal with tricky wording. If the buyer can’t understand the counteroffer, they won’t accept it.
There are four different types of commercial leases that each place different responsibilities on the tenant and landlord. These are known as net lease, double net lease, triple net lease, and absolute triple net lease. They can be abbreviated as N, NN, NNN, and Absolute NNN respectively. In general, N places the fewest responsibilities on the tenant and Absolute NNN places the most. However, in certain cases a tenant may prefer an NN lease over an N lease, if the tenant is adamant about not paying maintenance costs.
For each of these lease types, the tenant is responsible for their base rent plus some additional property expenses. The landlord in turn is responsible for structural issues, for all except an Absolute NNN lease, and may be responsible for some other costs. In an N lease, the additional property expenses tenant is responsible for include a portion of the property taxes, insurance, and maintenance costs. The landlord is responsible for major repairs. With an NN lease, the tenant is responsible for the entirety of the property taxes and insurance, but unlike an N lease, it’s the landlord who is responsible for maintenance costs. With an NNN lease, the landlord’s only responsibility is major structural repairs. The landlord’s only role for an Absolute NNN lease is collecting rent.
The high mortgage interest rates we’ve been experiencing have been the result of benchmark rate increases by the Federal Reserve. The benchmark rate isn’t directly tied to mortgage interest rates, but the benchmark rate does have a strong effect on interest rates. Now, though, no more rate hikes are expected, which should cause interest rates to level off, and then start to decline.
This levelling off followed by a decline is exactly what the Fed was aiming for with the rate hikes. It’s impossible for mortgage rates to drop without the real estate market, and in turn the economy as a whole, taking a hit. By raising rates above what they should be during a period of high prices, what the Fed has done is soften the blow by allowing the decline to be more gradual. Of course, this comes at the cost of significantly decreased affordability for the period of the rate hikes. Once interest rates fall below 6%, which should happen before the end of the year, the market should pick back up again. However, the effect may not be noticed until next year, as the end of the year is not generally a time of heavy market activity.
Some parents want to help their kids any way they can, including by helping them pay their mortgage. Or perhaps they’ve suggested that their inheritance be used for this purpose. Others want to instill the importance of financial responsibility or independence. Some simply can’t afford to help. But if you do want to help your kids with their mortgage, there is some important tax information you should be aware of.
One very common way for parents to assist their kids is with a financial gift. This isn’t just as simple as giving them money. Financial gifts above a certain amount per year do need to be recorded, and may be subject to a gift tax. In 2023, this amount is anything over $17,000 annually, but this value could change each year. Income tax could come into play if instead of gifting your child money, you provide them with a loan. The interest you receive on the loan must be reported as income and may be subject to income tax, and may also be deductible for your child. Capital gains tax is relevant if your kid inherits a property from you or you gift them a property. In the case of a gift, when your kid sells the home, they will need to pay capital gains tax if the home appreciated in value. In the case of inheritance, the capital gains tax amount is based only on the amount of appreciation and not the total value of the home.
Builders have had it rough the past few years. The pandemic resulted in skyrocketing lumber prices as well as many job losses for construction workers. In order to get the most bang for their buck, builders started building luxury homes, which generally have a higher profit to cost ratio. But this couldn’t last long, as both market demand and legislation pressured them towards construction of affordable living homes, while at the same time, zoning restrictions made even this rather difficult.
Pressures on construction companies have started to ease up in most of the country, but not everywhere. Particularly in the West and Northwest, available land is an issue. Fortunately, builders may have figured it out and now have a new plan: Make smaller homes. It’s predicted that more affordable starter homes will become available within the next year or two, as 42% of builders are reducing the square footage of their homes. It doesn’t even require a big change — the nation’s largest homebuilder, D.R. Horton, is only reducing home sizes by an average of 2%. Builders are also planning to build more townhomes and duplexes, which take up significantly less space per unit than single-family residences.
The initial estimate of the median home price in California in the first quarter of 2023 was $760,260, for single-family residences (SFRs) only. Using this estimate, about 20% of California households could afford to purchase a median-priced home. This demonstrates a rebound from the last quarter of 2022, where it had dropped to 17% of households, down from 24% in the first quarter of 2022.
Affordability is weakest in Mono County, which experienced no change from its very low 7% affordability. The most affordable county has remained Lassen County, despise a slight drop from 54% at the end of 2022 to 53% now. Mendocino County had the largest increase in affordability, an increase of 12% from 14% at the end of 2022 to 26% now. No decreases in affordability exceeded 3% during the same time frame.
Though the US as a whole is significantly more affordable that the rather expensive California, the numbers show a similar trend. Affordability was higher in the first quarter of 2022, at 47%. It had dropped to 38% in the last quarter of 2022 before inching back up to 40% in 2023. Only three California counties — Siskiyou, Plumas, and Lassen — have a higher affordability rating than the national average.
Come together for the Gathering for the Grand 2023! This year the grand event will be a live concert held at the Warner Grand Theatre, featuring premier Rolling Stones tribute band, JUMPING JACK FLASH! Jumping Jack Flash delivers that same raw, high-energy, larger-than-life rock show that you remember from the Rolling Stones. The honoree this year is the Warner Grand “herself”, right before the Theatre closes for its big renovation. Dress as your favorite rock star and celebrate the Theatre’s past, present and future!
Proceeds benefit Grand Vision Foundation’s performing arts & music education programs.
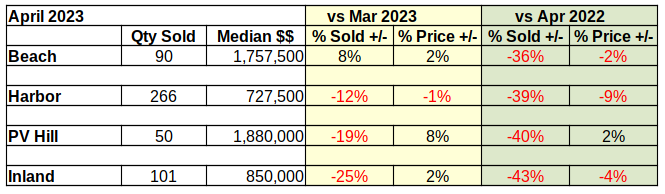
April of 2023 ended with a 40% drop in the number of homes sold across the South Bay compared to 2022. The median price was down 20% from last year in Palos Verdes and is up by a mere 1% at the Beach. Year to year median prices across the South Bay are down approximately 5%. Cumulative sales revenue for the first four months across the South Bay has dropped 39% from 2022 numbers.
Year to date, 2023 has been one of the slowest markets we’ve seen in recent years. Sales are off by 43% in the Beach Cities and are down by 22% across the South Bay compared to last year. Median prices escalated dramatically in 2021-2022, and are still above those of 2019 by 30-35%. However, the median has fallen in all four areas since late last year. We anticipate the median price continuing to drop until interest rates seriously decline again.
Business in the years between 2019 and 2023 was seriously impacted by the pandemic, and the massive government funds released to counter the effect of the pandemic. Looking back at 2019 and comparing it to 2023 offers a perspective on where the market is and where we can expect it to go during the balance of the year. Today we see a huge decline in the number of homes being sold. That has yet to translate into a significant decline in median prices, although 75% of year over year sales show prices falling.
At the same time the Average Days On Market (ADOM) has increased from about 7 days during the sales boom of 2021-2022 to about 30 days now. That’s a four-fold increase in the amount of time it takes to sell a home. For a seller who needs to move, that will feel like an eternity. It’s that sense of urgency that drives prices down and ultimately results in a shift of the market.
At the Beach “Sticky Prices”
Sellers in the Beach Cities had a good month in April—at least compared to March of this year. Compared to April of last year, the picture is far worse.
The number of homes sold in April was up 8% compared to March. That sounds positive, until the realization that sales volume was down 36% compared to April of 2022. At the same time, the median price was up 2% versus last month, and down 2% compared to the same month last year.
There’s a lot of talk among brokers these days about “sticky prices.” Recent sales at the Beach offer a good example of what that means. The statistics show that sales are down 36% from last year, however prices have only dropped 2%. Sales are falling because the number of viable buyers is down.
Interest rate increases have pushed the most tenuous group of prospective buyers out of the market. At the same time, sellers are still revelling in the boost to median prices that came with record low interest rates during the pandemic. Beach area sellers have yet to adjust to the reality of a re-trenching economy. That adjustment is “sticky prices.”
Harbor Sales and Prices Off
The neighborhood can affect how long it takes the median price to respond to changes in the economic environment. While sales volume and pricing has remained strong at the Beach, sellers and buyers in entry level communities are impacted more immediately by shifts in the economy.
Thus we see the give and take of the market bring median prices into a stable range early in the year in the Harbor area. The red line in the median price chart below shows four months of reasonably steady prices. While month over month prices have shown only a 1% drop, the monthly sales volume has taken a 12% dive from March, as shown in the Sales Volume chart, above.
The monthly decline in sales was multiplied in the year over year statistics. April sales volume was down 39% from April of 2022. For the same period, the declining sales volume was coupled with a 9% drop in median price. So the entry level communities demonstrate a much quicker and deeper response to changes in the financial picture.
Part of that response is the time on market, which has risen from 15 ADOM in mid-2021 to 26 ADOM in April of this year. The increasing time required to sell homes contributes to the number of homes available on the market. Both factors contribute to falling purchase prices.
Palos Verdes In Extremes
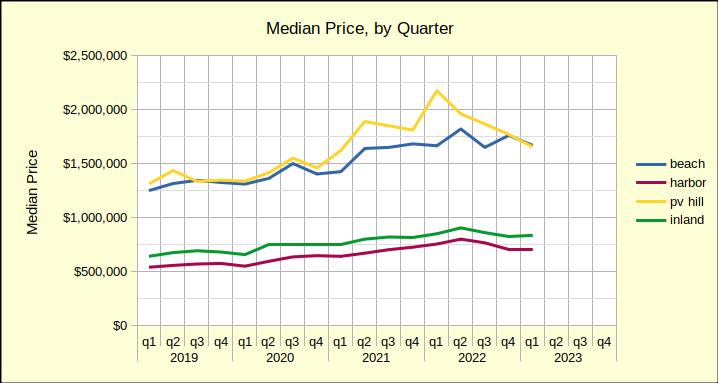
Through 2021 and 2022 home prices on the Palos Verdes peninsula benefitted from the Covid pandemic more than any area in the South Bay. In the median price by quarter chart, shown below, the yellow line is seen jumping up and away from the blue line of the Beach Cities. Unfortunately for home owners on the Hill, that price boost has already pulled back into line with prices of Beach area homes.
Comparing the first four months of the 2023 to 2022 median prices on the Hill have dropped 16%. It’s a steep decline in view of decreases at 3% and 6% in the Inland and Harbor areas, respectively. Even more so when looking at the 1% increase at the Beach.
The statistics look much better when comparing Palos Verdes sales from 2023 to statistics from 2019, the last “normal” year of real estate business. Sales volume on the Hill is down a modest 13%–modest by comparison to the Beach, which is down 43%. In contrast, median prices in 2023, compared to 2019, are still showing positive growth of 30%.
So, if one were to take the Federal Reserve System position that 2% annual growth is a desirable target, where would prices be today? The median price in Palos Verdes in May of 2019 was $1.5M. Jump forward to 2023 and that becomes about $1.6M. The median on the Hill last month was $1.9M, which suggests further price reductions.
Inland – The Steepest Fall
From an investment perspective, homes in the Inland area of the Los Angeles South Bay are “bread and butter.” These are the homes, much like those in the Harbor area, which reliably increase in value over long periods of time at a slow and steady rate. Most importantly, they house the bulk of our community.
In the short term, Inland home sales volume is down 25% from March to April of this year. Median prices are up 2% for the same period. This is the steepest fall in number of homes sold in the four areas charted.
Year over year, sales volume is off even more at 43% below April of 2022, and prices similarly down by 4%. We expect a seasonal boost to sales for the second quarter, when families most frequently schedule moves. Beyond that, most predictions are for continued softening in the real estate market as the Fed struggles with inflation. (The April Consumer Price Index, [CPI-U] for Los Angeles metro was 5.2% for Housing.)
If you’re planning to hire a contractor, chances are it’s because you don’t know how to do the work yourself. Because of this, it’s common to believe that the contractor knows what they’re doing and you don’t need to get involved or ask questions. But that couldn’t be further from the truth. Communication is very important when dealing with contractors to make sure the job that’s being done is the job you wanted. It may require a bit of research, but you should learn how to ask the right questions to get the right contractor for your job.
The specifics will depend on the particular job you want done, but there are some things you should be doing prior to choosing a contractor regardless of the job. When looking for a contractor, get quotes from multiple people and verify all of their credentials, licenses, and certifications, as well as experience. Make sure the contractor you pick has liability insurance and worker’s compensation insurance. The next part is what may require some additional research, and that is defining the scope of the job and setting a timeline. If you don’t know exactly what you’re looking to be done, the contractor won’t either, even if they know how to do it. When you get the contract, make sure it contains all the necessary elements before signing. A proper contract contains all the terms and conditions, payment information, warranties, and dispute resolution procedures.