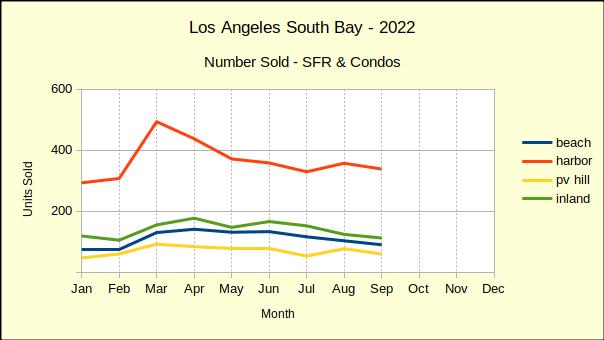
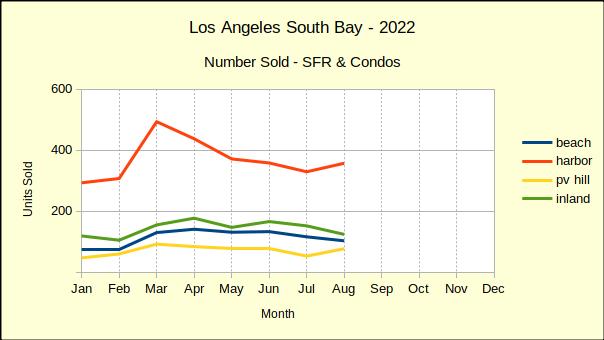
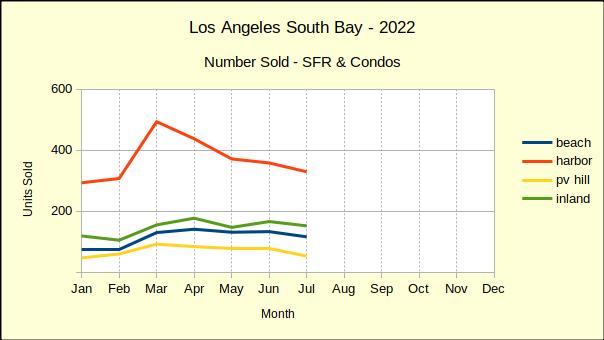
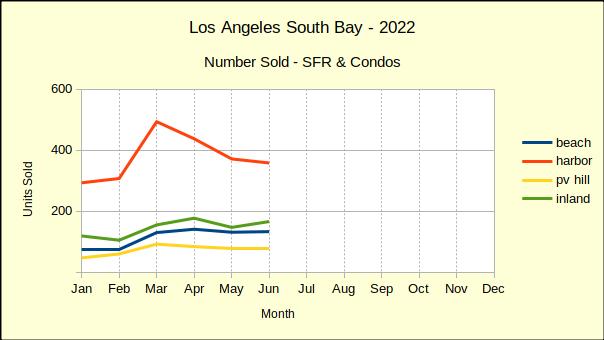
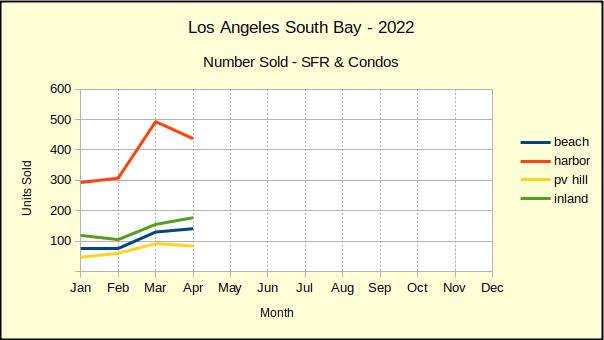
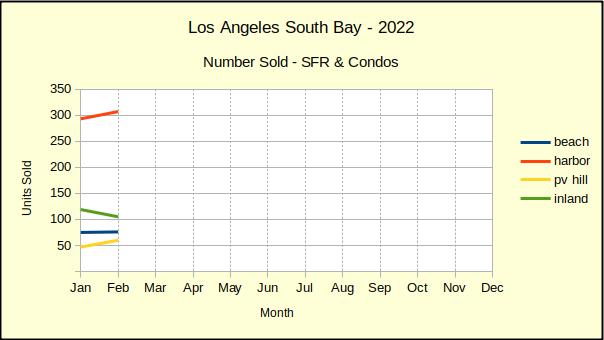
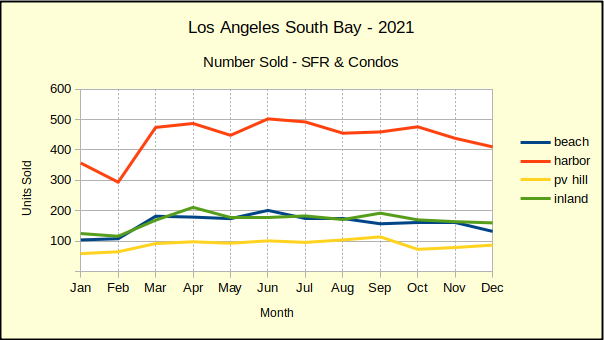
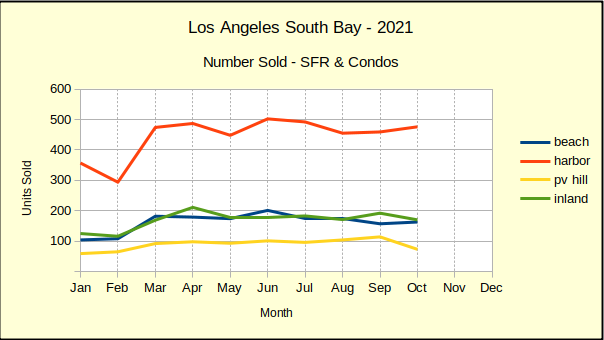
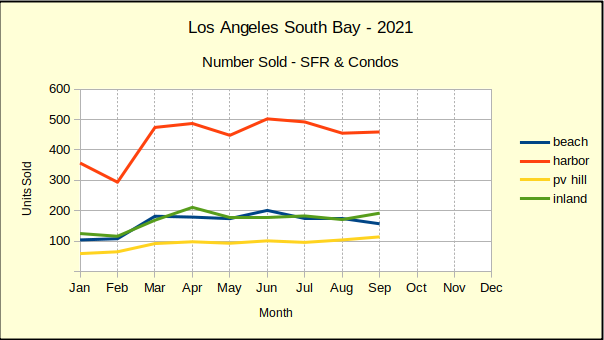
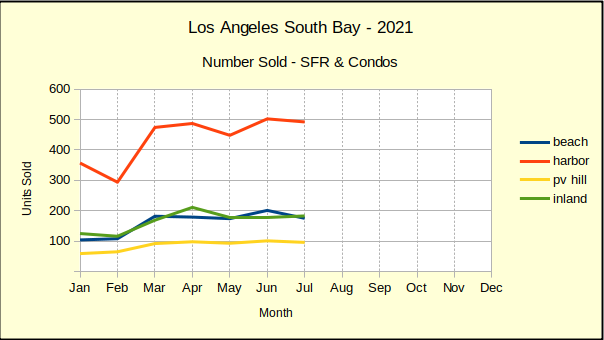
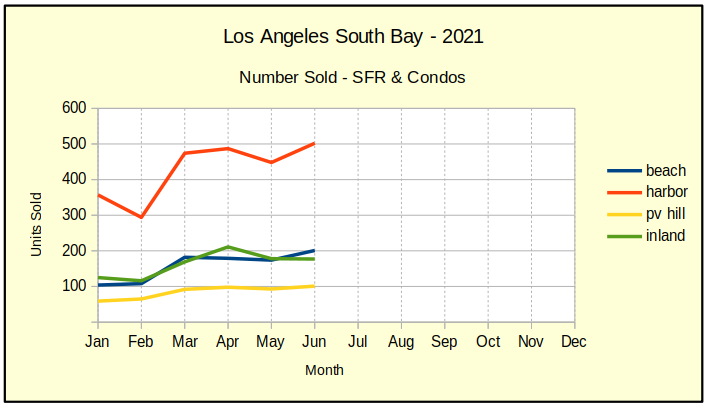
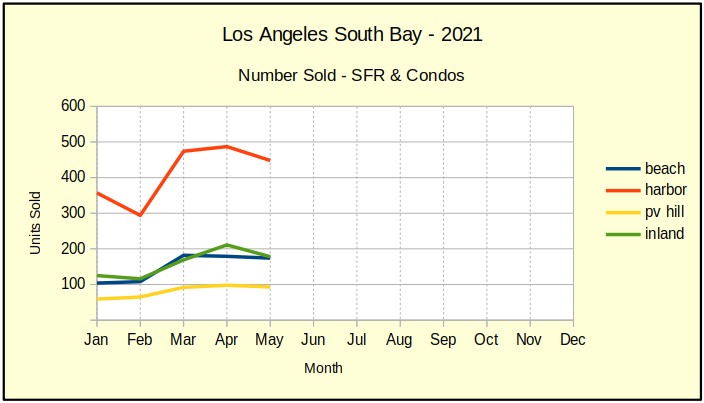
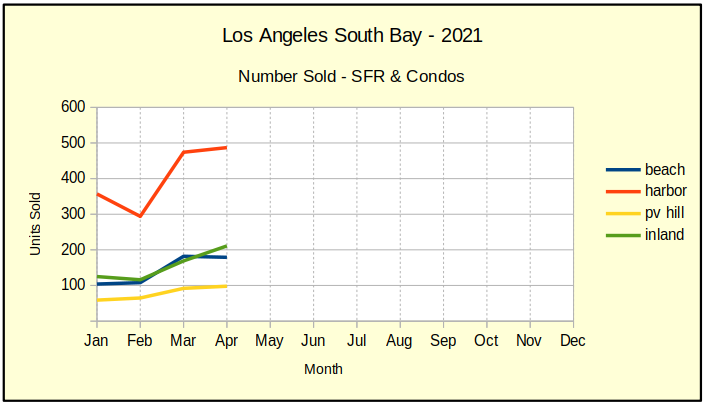
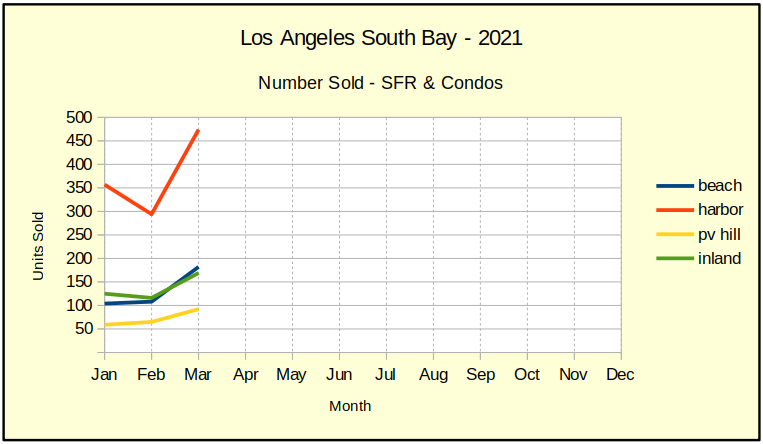
Compared to October of last year, home sales in the Los Angeles South Bay have dropped by 40%. Hardest hit was the Harbor area which fell 47% from last year’s October numbers. The Beach Cities were down 40%, while the PV Hill and the Inland area fell 32% and 25% respectively.
Month to month sales across the South Bay were down another 12% compared to a 9% drop in September. Looking at the different communities found mixed results. The Beach and Inland areas improved sales over September statistics, while the Harbor area and PV Hill continued downward. Harbor area sales plummeted another 20%, falling from -5% last month to -25% in October.
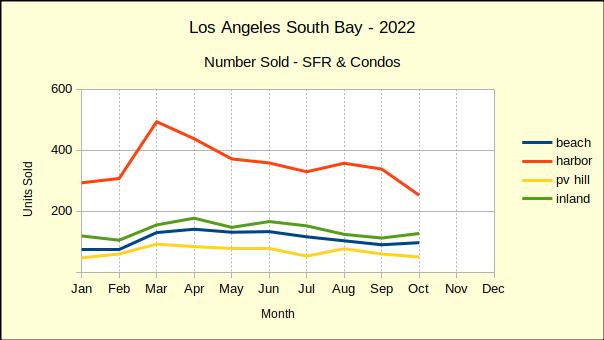
The pandemic created a wild roller-coaster ride for Harbor area real estate. Being the least expensive of the four areas, Harbor area homes are the most affordable and attracted the most attention when interest rates were ultra-low and entry level buyers were able to qualify for purchase loans. Now, with the interest rate already double the 3.5% of 2021, many potential buyers no longer have the cash flow to purchase.
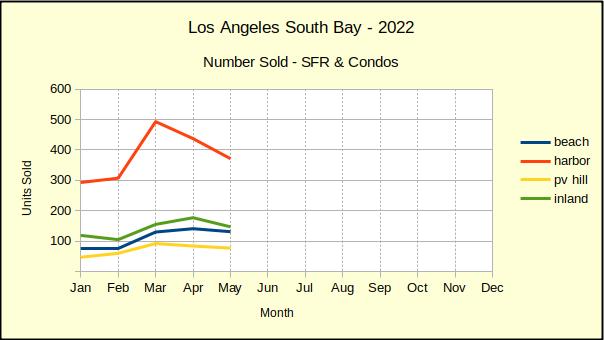
Note that 476 Harbor area homes sold last October versus 252 this October. Looking back to 2019, the most recent “normal” year we find there were 397 homes sold in the Harbor area. This demonstrates how artificially inflated sales figures were in 2021 and how far sales have already fallen in just seven months from the peak.
In mid-November, following another .75% increase by the Federal Reserve System, the Mortgage Bankers Association is reporting a drop of 46% in mortgage applications to purchase a home compared to last year. That decline is accompanied by an 88% decline in applications to refinance a home loan. That amounts to a lot of money out of circulation in the economy.
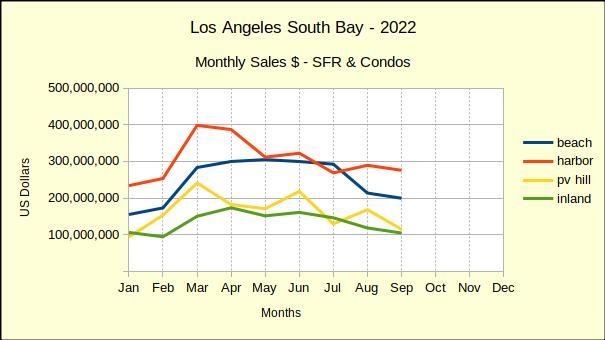
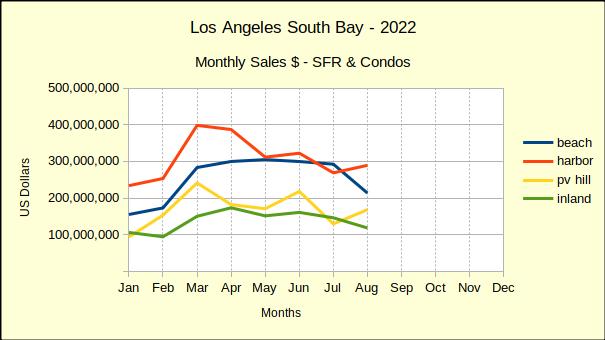
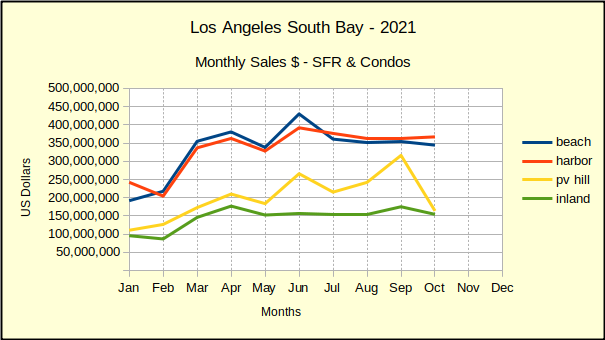
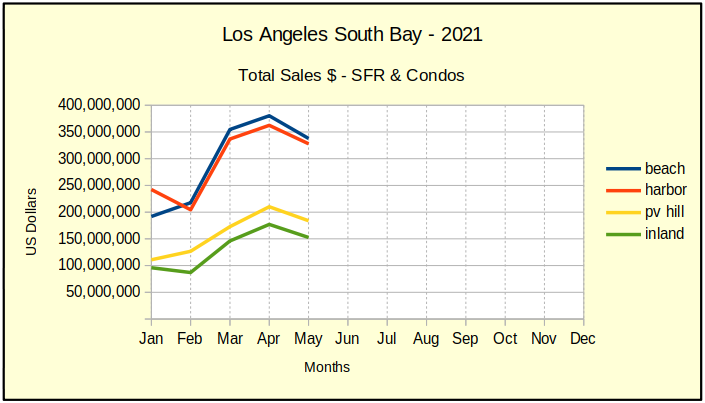
Total Dollars in Sales Declines $1.8 Billion
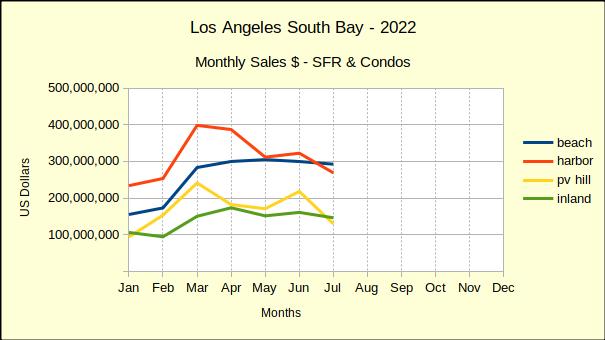
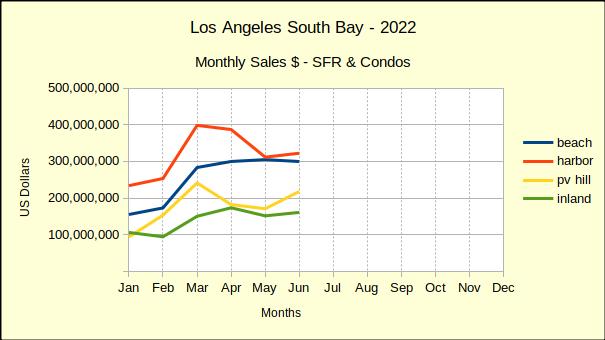
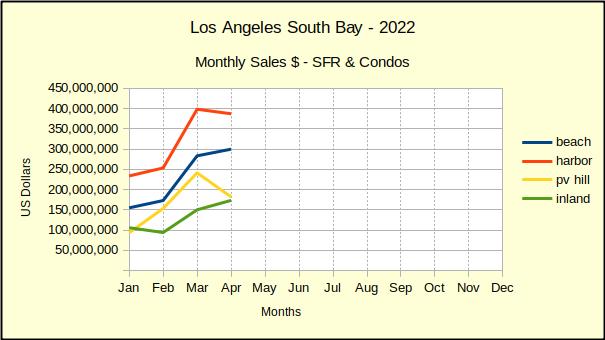
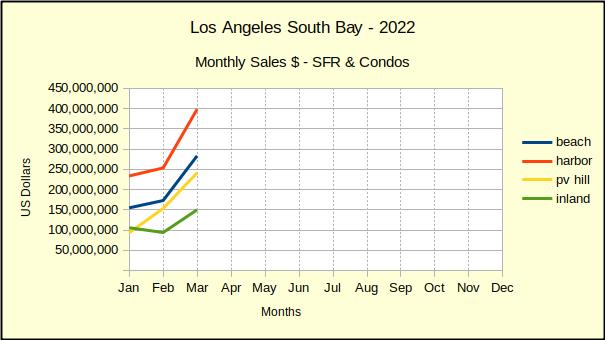
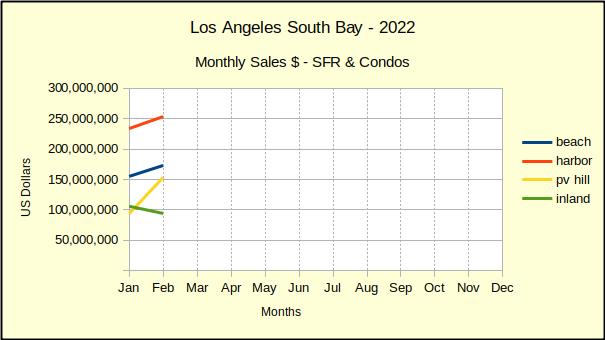
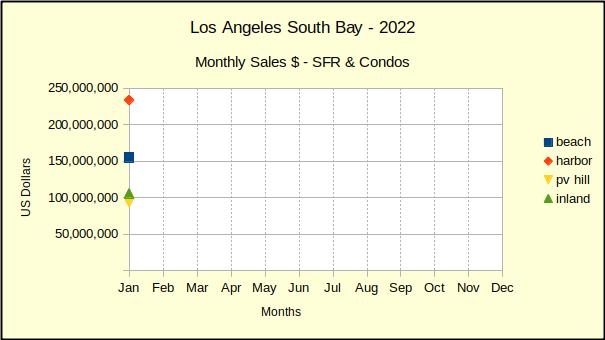
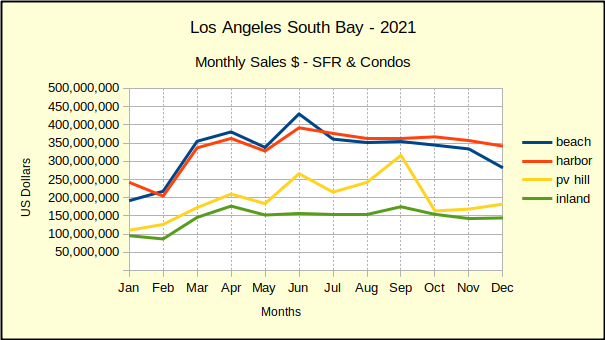
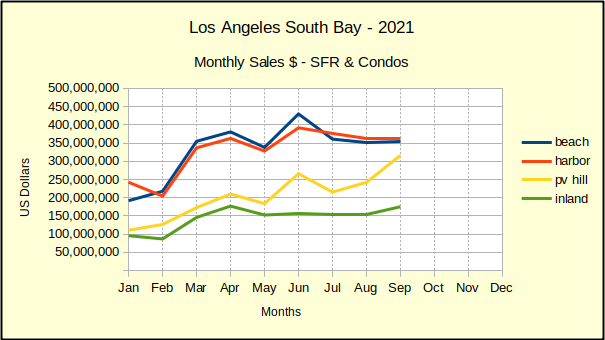
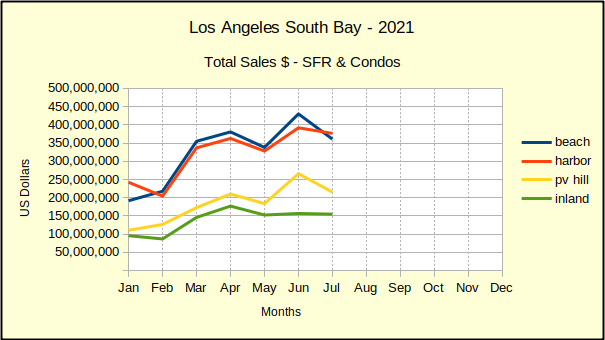
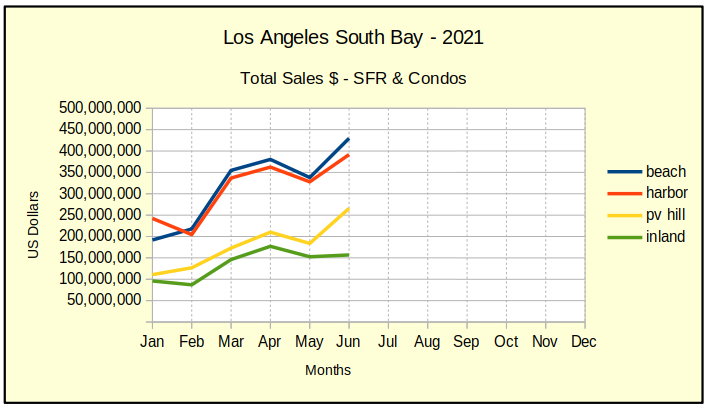
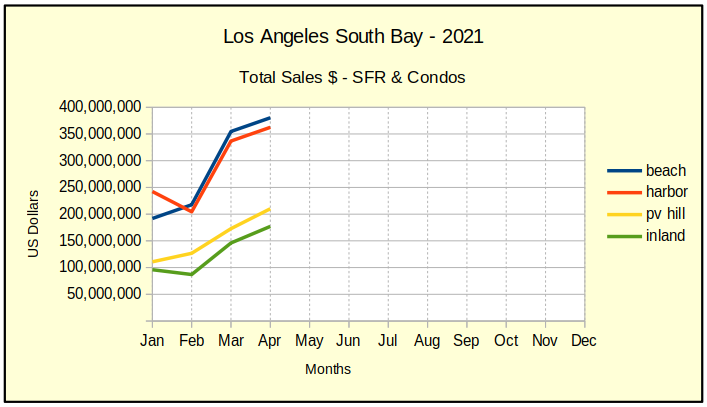
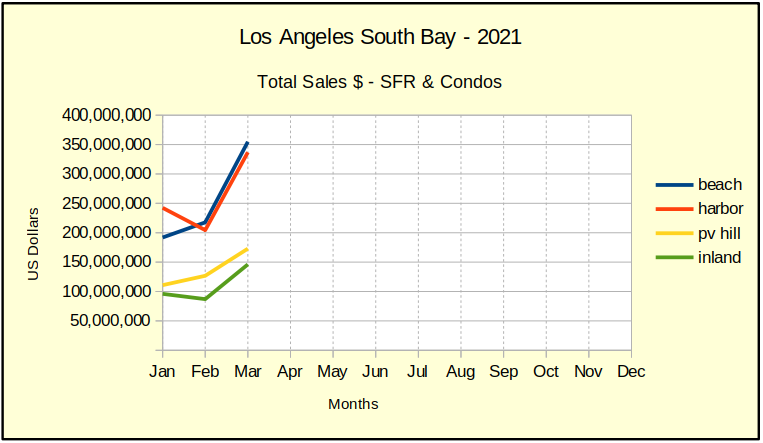
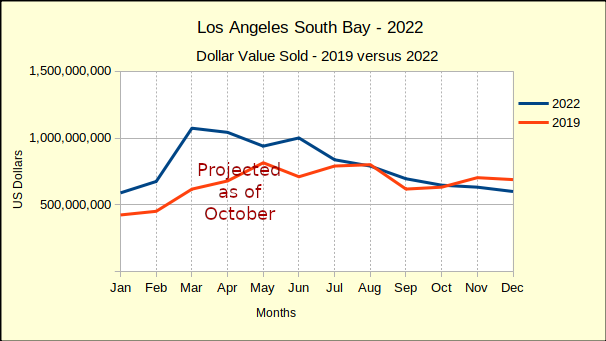
As of the end of October South Bay home sales for 2022 total $8.3 billion. That compares to $10.1 billion for the same time frame in 2021. Already this year the gross sales revenue has fallen by $1.8 billion, or 5%. As the market slips deeper into recession, we expect the monthly sales revenue will continue to decline, shrinking the total even more.
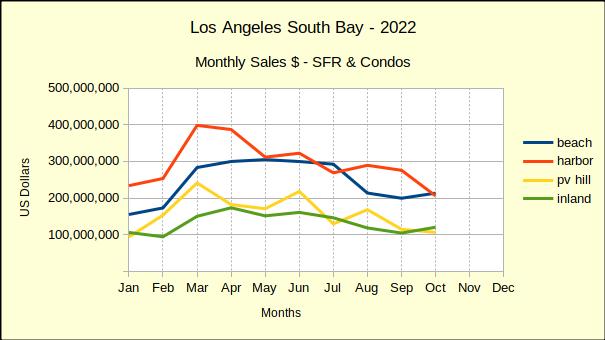
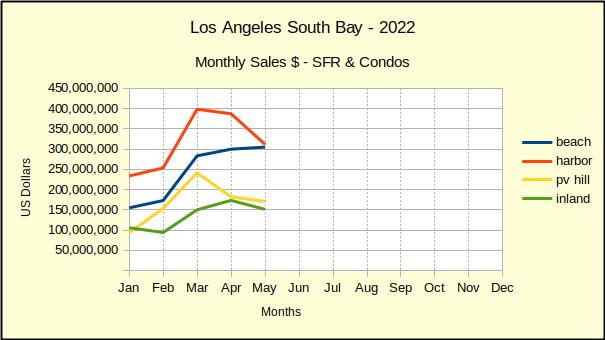
The graph above shows the downturn starting in March and generally trending down for the balance of the year. It’s important to remember that home sales are a major driver in the economy. Every home sold results in a miniature boost to the economy as new homeowners relocate, acquire new furniture & appliances, repair and update their new home. Most experts estimate an additional 15%-20% for ancillary economic activity stimulated by real estate sales.
Using 2019 as a baseline, we can trace the rise and fall of the South Bay real estate market through the pandemic. In 2019 the total cumuilative sales was $7.9 billion. In 2020, when the pandemic hit and the government began piling on financial assistance and incentives, the annual sales reached $8.7 billion. When 2021 rolled around the ultra low interest rate alone was enough to drive annual sales to $12.1 billion, an increase of 53% over the 2019 sales figures. Looking now at 2022, we are forecasting a year end total of approximately $9.5 billion, a decline of 22% from 2021.
An additional concern this year is the reduction in local and state tax revenues. The pandemic forced significant governmental expenditures to mitigate harm to citizens. A recession, coming on the heels of Covid-19, threatens to up-end the economy. California’s budget reserves haven’t yet recovered from the pandemic and state revenues are already slipping.
Median Price Shifting Down
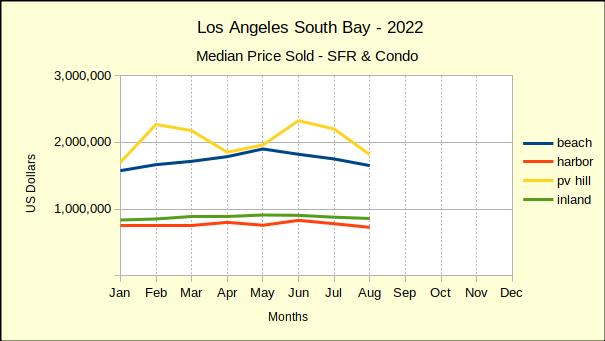
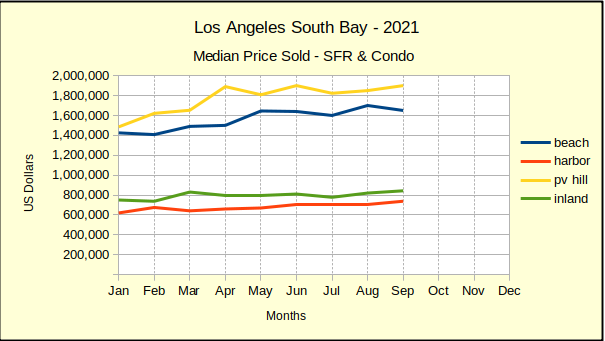
Wealth is often measured by the value of owned real estate. For most families their real estate is the home they live in, which is valued per the median price of comparable homes. Thus, nearly everyone is interested in the median price for the area.
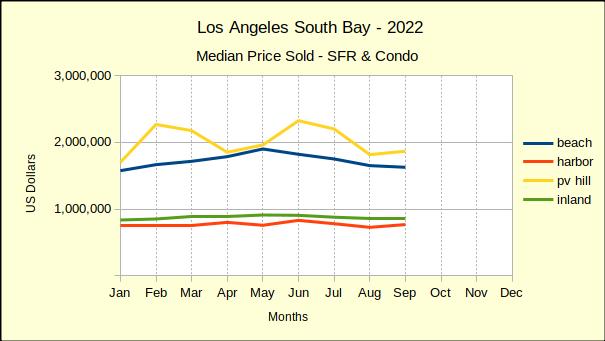
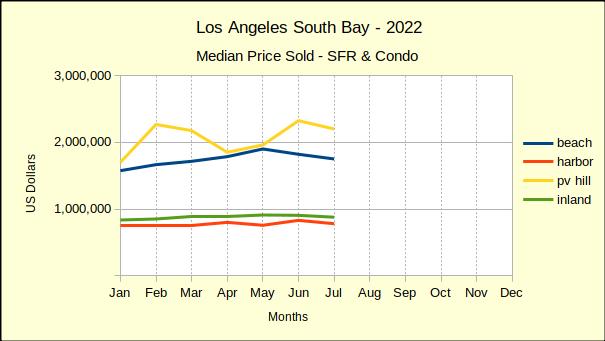
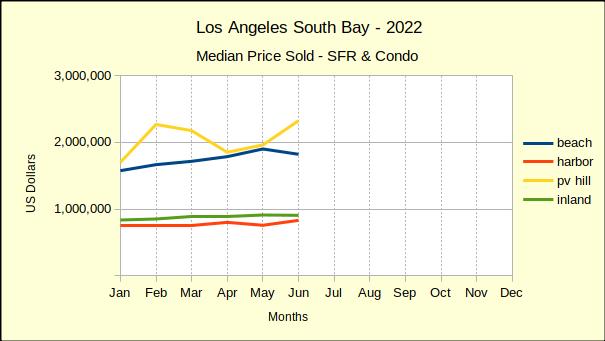
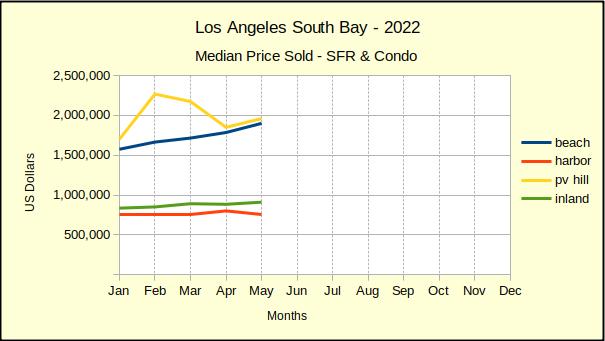
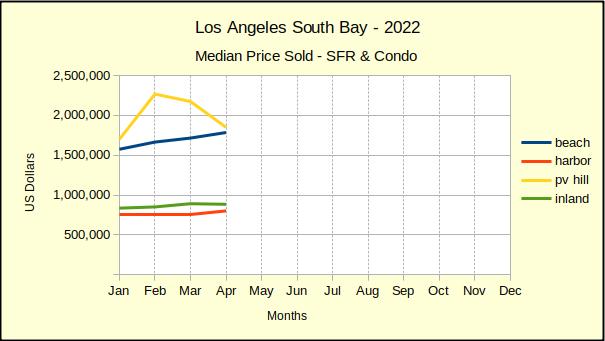
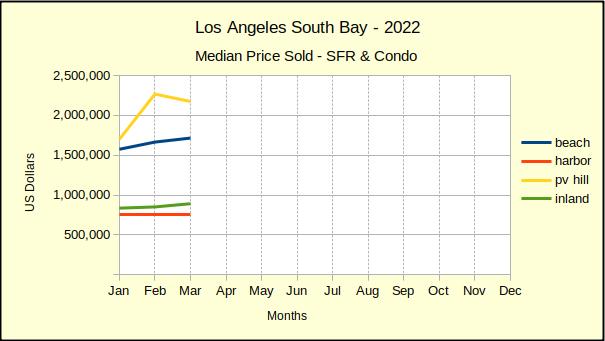
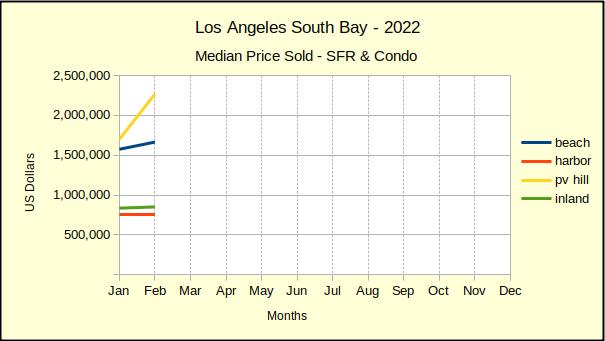
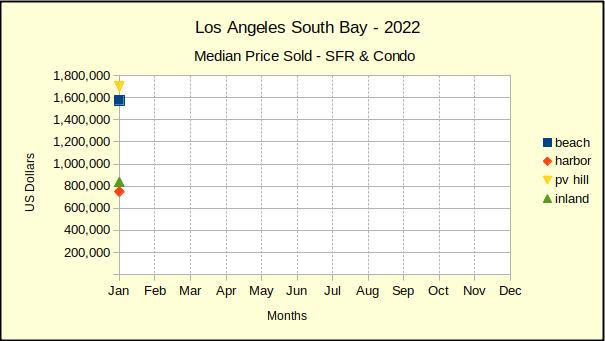
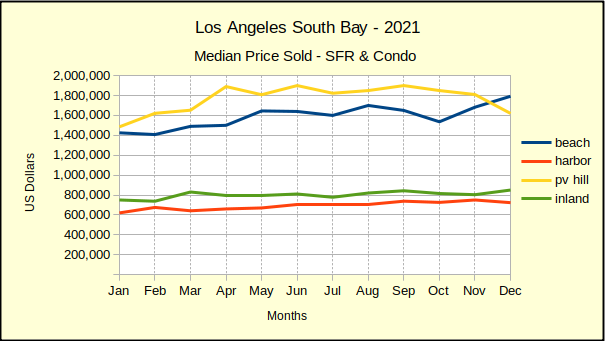
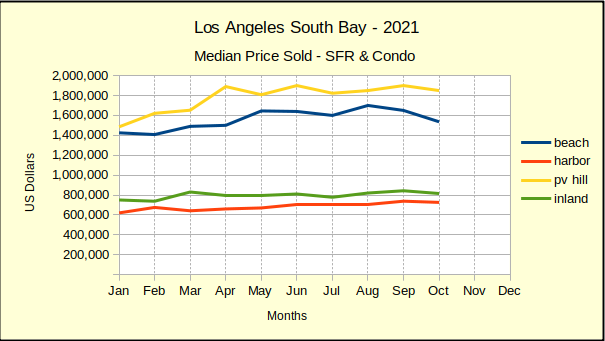
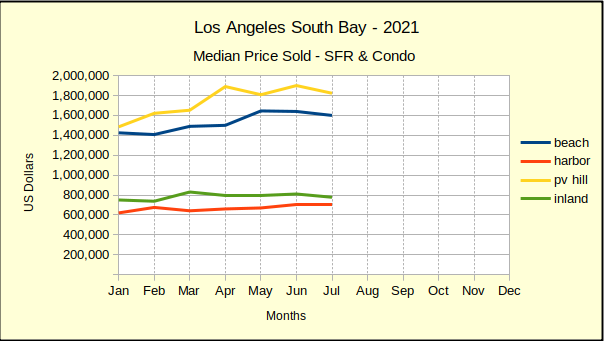
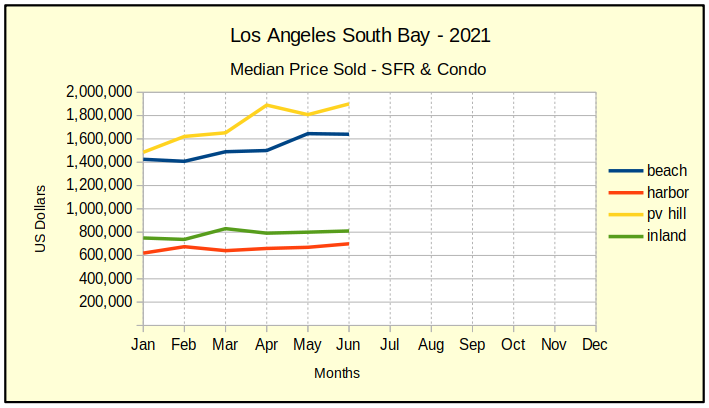
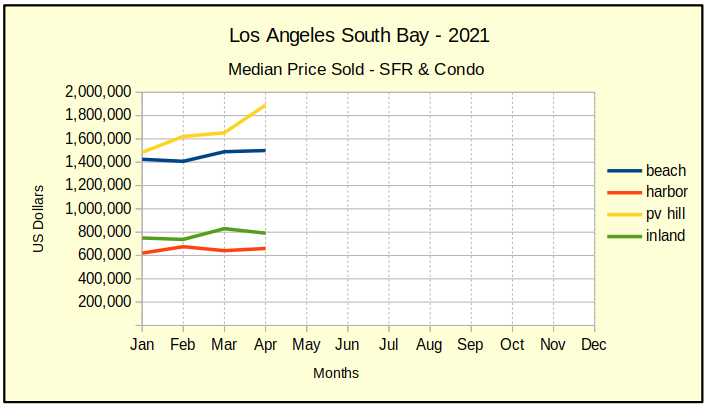
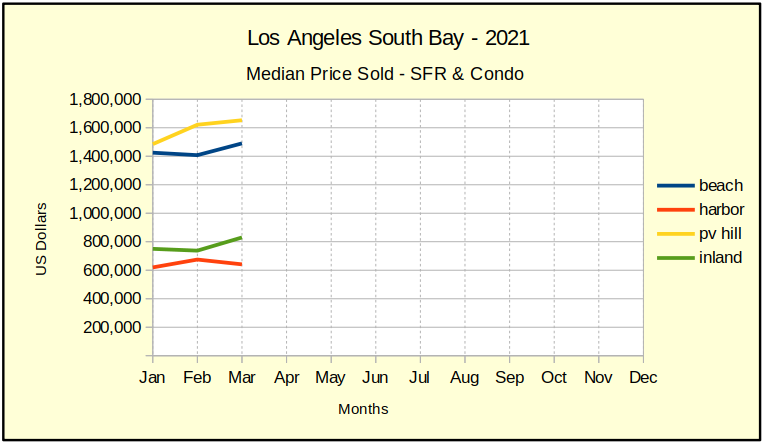
Year over year, comparing 2021 to 2022 for the same month, the median price continued to rise until August of this year. Since then results have been “choppy” with median prices down August, September and October for PV Hill sales, down two months out of three at the Beach, down one month in the Harbor area and up all three months in the Inland area. (How the areas are defined may be found at the end.)
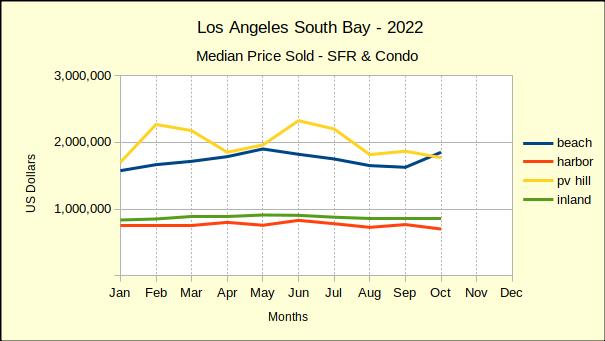
Looking month over month, comparing each month to the one prior, shows a clearer picture. January started the year with declines compared to December, both at the Beach and in the Inland area. By July and August all four areas were showing declines compared to the prior month. The repeated monthly decreases in the median prices built up to the annual decreases which began showing up in August and have continued through October.
When Is It a Recession?
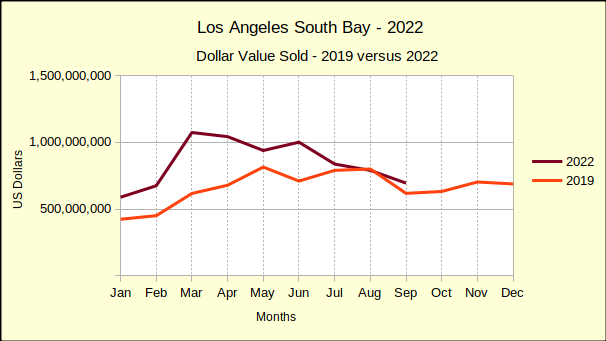
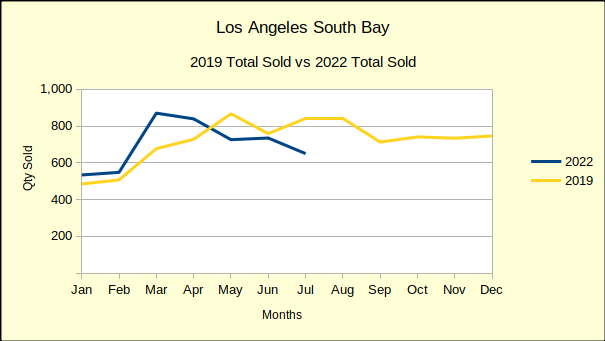
Since June of this year the total dollar value of South Bay sales has been declining. Combined, the precipitous drop in number of homes sold and the gradual decline in median price are driving the revenue below that of 2019 on a monthly basis. The chart below shows August as the first occasion where the total dollar value of homes sold in 2022 fell below the monthly sales in 2019. October sales for this year ended just shy of the same month sales in 2019.
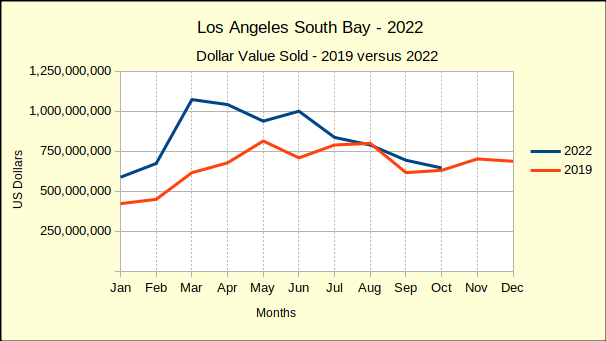
Our projections (shown below) for the 2022 year end indicate the total sales for the year will fall below the 2019 total sales dollars. While this isn’t an official definition, or designation, it matches our understanding of a recession. Any time our financial situation is headed backwards in time we think of it as a recession.
The challenge now is to consider how this recession will play out in time. The Federal Reserve System (Fed) has changed the game rules since the Great Recession. A prominent change has been the speed with which the Fed raised the prime rates for member banks. In response to the Great Recession, the Fed gradually raised rates over a period of years. This gradually slowed home sales. This time, the Fed has raised rates much faster, resulting in much more immediate impact on the real estate market.
At the moment, all expectations are for another rate increase in December, despite indications the economy is crashing. A seriously disappointing Black Friday might convince the Fed to ease up, but we’re anticipating that relief. If history and the immediate data proceed along the current path we should see a lot of price reductions in 2023.
For those who must sell, it’s an unfortunate time. There are ways to ameliorate the negatives, but it will probably still be negative. Those who are in a postion to purchase have the benefit of reduced prices, combined with the negative impact of higher interest rates. Generally speaking, very few are happy with a recession, though we have talking to a group of buyers who think pooling cash and buying as a consortium/collective is a masterful idea right now.
At a Glance
In addition to being relatively self explanatory, our At-a-Glance table is discussed throughout the above paragraphs. We won’t bore you with any more chatter about it, but we find it immensely useful as a quick reference. Some of our readers have even said they immediately go to the bottom of the article to see how much red ink there is. (Sorry. It is getting redder, but there are some delightful opportunities out there.)

Disclosures:
The areas are:
Beach: comprises the cities of El Segundo, Manhattan Beach, Hermosa Beach and Redondo Beach;
PV Hill: comprises the cities of Palos Verdes Estates, Rancho Palos Verdes, Rolling Hills and Rolling Hills Estates;
Harbor: comprises the cities of San Pedro, Long Beach, Wilmington, Harbor City and Carson;
Inland: comprises the cities of Torrance, Gardena and Lomita.
Photo by jordis small on Unsplash
