The original BeachChatter discusses the housing market in the coastal communities south of the city of Los Angeles. Some articles are peculiar to a single city. Some discuss the region as a whole. The focus is on privately owned housing.
Spring is almost always the hottest season for real estate. It’s very likely that it will be this spring, as well. However, things are going to be a bit different. The market feels somewhat volatile at the moment, with prices having plummeted rapidly immediately after a dramatic increase. Mortgage rates, having reached their peak, are now beginning to tick down over time, but it’s hard to gauge rates on a day-to-day basis. Sales can’t be predicted at all based on job growth, since the job growth is primarily reduced unemployment. This uncertainty is going to make buyers more cautious than usual this spring.
That’s not necessarily a bad thing if you are looking to buy, though. Prices may not be at their lowest point, but they don’t have much farther to fall given inflation. Mortgage rates are no longer inordinately high. And importantly, competition isn’t going to be as high as it is most spring seasons. That means you have time to shop around, look for the best deals, and watch how the market pans out. If you get out there looking now, you’ll have a better idea of where the market stands by the time you find something that’s right for you. But make sure you’re prepared to buy and have a pre-approval. If you wait too long, demand will start to go back up as mortgage rates continue to fall, and suddenly you have competition.
Until the end of January 2023, the City of Los Angeles has been under its own eviction moratorium laws, separate from those of the county as a whole. The city’s moratorium has ended. However, the county’s moratorium isn’t over yet. Every city in LA County is now under the county’s moratorium rules.
With the LA City rules gone, tenants are no longer able to defer rent payments. But note that the rent freeze is separate and not part of the eviction moratorium. Rents still cannot be raised on rent-controlled properties in Los Angeles until January 31, 2024. Under the county eviction moratorium, evictions are allowed only under certain circumstances. If the circumstances are related to COVID, it’s very likely that the landlord cannot legally evict. Also, use of the Ellis Act to evict tenants by removing the property from the rental market is still not permissible until April 1, 2023. If the tenant breached the rental contract, though, the landlord is probably able to evict, with a few exceptions.
Those who are not citizens or possibly not even residents of the US may have trouble qualifying for mortgage loans. Fortunately, there is an option available, so you don’t necessarily have to be stuck renting if you have just recently moved to the US. ITIN stands for Individual Taxpayer Identification Number, and is a number that the IRS can assign to taxpayers who cannot get a Social Security Number. If you apply and are assigned an ITIN, this can help you qualify to get an ITIN loan.
While you don’t need to be a resident or citizen, there are still some requirements for ITIN loans. You do need to provide tax returns and may have to fill out Form W-7. It’s possible that you will also be asked for additional forms of identification, such as a driver’s license or birth certificate. As with any mortgage loan, you will be expected to provide proof of income, assets, or employment.
The prevailing narrative is that senior living communities are designed for elderly retired people. However, they are generally open to anyone over the age of 55. Most people age 55 aren’t retired yet, and this certainly isn’t very old. You may not think you need to live in a senior living community yet, but it isn’t about necessity. There are benefits to it that you may want to take advantage of as early as possible.
Even if you don’t consider yourself in poor health, certain laborious tasks can become more difficult — if not impossible — at a relatively early age. Many senior living communities have full time maintenance staff, so you don’t need to worry about it at all. There will probably also be a dining hall, so you may not need to cook. Because the community will be expecting that some members have reduced physical capabilities, there will be some small benefits that can make your life more convenient even if you don’t strictly need them. This includes no or fewer stairs, more railings, and slip-resistant flooring. But these communities haven’t forgotten about their physically fit residents; many senior living communities have their own gym.
A little known fact is that lease agreements actually establish two entirely separate legal relationships between the landlord and tenant. The first is a right of possession granted to the tenant, and the second is a list of contract rights, which is what allows the landlord to collect rent. Though the lease agreement establishes both of these, they can be cancelled separately and through different means, though certain actions can cause both to be cancelled simultaneously. Cancellation of the right of possession is termed a forfeiture, and cancellation of the contract rights is called a surrender.
Because a tenant can’t unilaterally forfeit their right to possession or have the landlord surrender their contract rights, it falls on landlords to follow the proper procedures when a tenant chooses to vacate the property or stop payments. A savvy tenant could escape paying missed rents if the landlord unwittingly cancels the contract rights. On the other hand, a savvy landlord could put a former tenant on the hook for missed rent payments if they follow all the legal procedures, though one of the legal procedures involves notifying the former tenant, so this isn’t necessarily easy.
It’s always in a vacating tenant’s best interest for the contract rights to be surrendered. Landlords need to be careful of following the law when attempting to lease a property that is legally still in a vacating tenant’s possession, but it’s not always in their best interest to initiate a forfeiture. The landlord could instead act as the tenant’s agent in subletting the property, while continuing to collect rent from the tenant for the remaining duration of the lease agreement. However, to do this, the term of the sublease must end on the same date as the existing lease agreement, otherwise the landlord is considered to have illegally given possession to a new tenant while the former tenant still retained it.
During the pandemic, there was a large influx of young adults who moved back in with their parents during lockdowns, or simply stayed there if they already were. There were various reasons for this — some include not wanting to be away from them while isolating, losing their job or transitioning to work-from-home, or graduating from college — but regardless of the reason, many of them were able to spend the last couple of years saving up money for a down payment. Now these young adults are looking to buy, in many cases for the first time, as they were probably renting before.
The share of adults age 25-34 living at home has been steadily increasing since 2003, when it was 10%. Back then, that age group was entirely Generation X. Now in 2022, it’s almost entirely Millennials, and the youngest among them are in Generation Z. But 2020 was actually the peak year, despite being the year of the sharpest increase. It has since decreased from 17.8% in 2020 to 15.6% in 2022, about the same level it was at in 2015. Based on historical trends, it’s expected that the number will drop back down to somewhere in the 8-12% range at some point, but this is unclear given that the steady increase was already in progress long before the pandemic.
Millennials currently form the largest cohort of homebuyers, and have done so for about a decade. That means the places where millennials are looking are probably going to be the hottest spots overall. By looking at mortgage data, LendingTree analyzed the top metro areas where millennials are considering buying. Note that this doesn’t include full cash sales since it’s derived from mortgage data, and LendingTree only has access to mortgage data for users of their platform.
LendingTree found that millennials make up the largest share of homebuyers in all 50 of the largest metros, and are a majority in 37 of them. The top metro area is San Jose, CA with 63.57% of mortgage offers going to millennials. The remaining top 10 are Denver, CO; Boston, MA; Seattle, WA; Austin, TX; San Francisco, CA; New York, NY; San Diego, CA; Los Angeles, CA; and Washington, DC. Narrowly missing the top 10 is Pittsburgh, PA, only a hundredth of a percent below Washington, DC’s 56.35%. But really, millennials are buying everywhere — not a single metro has a millennial homebuyer share below 40%, the lowest being Las Vegas, NV at 41.92%.
The housing market has its ups and downs, but it’s a relatively resilient business. There’s almost always at least one reason for some segment of the population to sell, even if the economy is looking shaky. However, interest rates definitely aren’t one of them, since 93% of homeowners already have a mortgage interest rate below the current average. But again, that doesn’t mean there aren’t other reasons to sell.
There are plenty of reasons, in fact. The five most common reasons to sell right now only account for 62% of sales as a whole. Only one accounts for more than a fifth of sales, which is wanting to move closer to loved ones, the reason for 21% of sellers. There are two reasons cited by 11% of sellers each, retirement and the neighborhood becoming less desirable. Upsizing accounts for 10% of sales, and 9% say that the structure of the household changed.
With home prices having skyrocketed and now starting to slow, many homebuyers are curious whether it’s a good time to get a home equity loan. In a survey of 1000 homeowners by MeridianLink, 21% stated they were considering getting a home equity loan at some point during the year, compared to just 8% last year. However, a little under half — 48% — aren’t even confident they know what a home equity loan is, or definitely don’t know, which encompasses 13% of respondents. Rising prices have, in fact, increased total equity by 15.8%. But that’s not the only thing you need to know.
The most important factor to keep in mind is whether it’s actually a home equity loan you’re interested in, or the similar but distinct home equity line of credit (HELOC). The answer will depend what you need the funds for and how quickly you want to repay it. A home equity loan has a fixed interest rate that is locked when you take out the loan. They’re relatively safe if you have good credit, but with current interest rates being high, they’re most useful for short-term uses, such as funding home improvement projects with a solid return on investment. HELOCs, on the other hand, have a variable interest rate that is based on the benchmark rate. The benchmark rate is currently still increasing, but that should change in the not-too-distant future. Therefore, a HELOC can be useful if you want to take advantage of high equity now and aren’t particularly worried about paying it off any time soon.
You may be surprised to find that there are actually far more single women who own homes than single men who own homes. Given that the wage gap is still a persistent problem — women earn 83 cents per dollar that men earn, on average — it doesn’t seem like this would be the case. But single women own over 2 million more homes than single men. The trend exists nationwide; there are only two states where single men own more homes than single women, North Dakota and South Dakota. So what’s the reason for this?
There are a few different reasons. It’s true that there are, in fact, more women than men in the US, but this alone doesn’t account for the vast difference. A significant factor is life expectancy. It’s five years higher for women than men, 81 years versus 76 years, for a variety of reasons that we won’t get into here. The result of this is that many homes owned by women are owned by widows who outlived their late husbands. Another reason is that women are more motivated to find success, as a result of historical — and continuing — discrimination. They’re more likely to seek to purchase than rent, even if they’re equally able to afford it. This is especially true among younger women. There are also more college educated women than men, which may lead them to make better financial decisions.
Buying a house is a tough financial decision, but it’s a lot easier if you know where you stand right now. Perhaps you check your bank balance regularly enough to know how much you currently have — but do you know how much you spend, and where the spending goes? Before buying a house, especially if you need to take out a mortgage loan, make sure you know what you can afford.
The first thing you should do is organize your budget. This doesn’t necessarily even mean you need to make changes, but you’ll need to figure out whether you do or not. List all your sources and amounts of income and expenses. No one is going to remember what all they purchased, but you can use your credit and debit card statements to help. There is software that can help with arranging all the numbers. Those of you who regularly itemize your tax returns will be familiar with this and may be already up to date, but it’s common to take the standard deduction instead, so you may not be used to it.
Step two is to get a copy of your credit report. Not only does this show you where you stand with credit — and therefore whether or not you can afford to take on more debt — but it’s the same information mortgage lenders will be looking at. You’ll want to make sure you and the lender are on the same page with your credit history. This can be done once per year for free from government-approved websites. Be careful, though — there are a lot of scam credit reporting websites out there.
Finally, ensure that you have enough for a down payment. While a down payment isn’t strictly necessary, some lenders have a minimum down payment for loans. Even if there is no minimum, both the interest rate and the initial balance due will be higher with a lower down payment. A down payment of 20% of the purchase price or more is ideal; however, that doesn’t mean it’s a problem to put down less. Many buyers can’t afford to spend that much upfront.
You’re probably aware that the Federal Reserve has been repeatedly hiking up interest rates. The idea behind this anti-inflationary measure is that increasing interest rates will result in lower consumer spending, which will force prices down to recover demand. The Fed’s eighth and most recent benchmark rate increase was on February 1st, just a couple days ago. However, this increase was the lowest of the series — only 0.25 percentage points, compared to prior increases of 0.75 or 0.5 percentage points. This is because we’re starting to see the desired result, decreases in inflation. It’s not enough to stop cold turkey, but it’s enough to reduce the pressure on interest rates.
But what else has the increasing benchmark rate done, besides reduce inflation? Well, obviously it has increased interest rates. This includes credit card rates, auto loan rates, and some student loan rates. Up until recently, it has also included mortgage rates. But mortgage rates are only indirectly affected by the benchmark rate, and they’re actually starting to decrease now. Another rate indirectly affected by benchmark rates is the savings rate. You’ll start to earn more money from savings accounts and certificates of deposit. It’s important to note, though, that with inflation being as high as it is right now, it has already entirely negated the effect of this savings over time, so you’ll have to save for quite some time for it to matter.
Much of the slow progress of zoning reform can be attributed to Not-in-my-backyard advocates, or NIMBYs for short. This refers to the homeowners that are resistant to reform because they believe it will decrease their home’s value, thus reducing their future sale profit. One big target for NIMBYs is low-income housing. It’s true that low-income housing is probably less valuable itself than the NIMBYs’ homes; however, to assume that it would drag down the value of nearby homes is simply inaccurate.
In fact, the addition of low-income housing actually increases the value of mid- and high-tier housing within a half mile radius by about 4%. There are a few different reasons for this. First, low-income housing in mid- or high-income areas generally also translates to multi-family residences. Higher density housing means an uptick in population density, which also usually increases home values. In addition, new multi-family housing construction is most often replacing either tear-downs or vacant lots. The area’s average value would actually increase just with that new construction alone, without any change to nearby home values. Finally, in areas that are already experiencing price growth, low-income housing further accelerates it by increasing existing high demand in that area.
The housing shortage we’re currently experiencing has been attributed in large part to lack of construction. There’s a lot more to the story, though. First of all, the slow construction doesn’t even account for all of our housing shortage — there are other factors such as increasing population, a rapidly changing housing market, and vacant homes not for sale or rent. As far as construction, the problem isn’t merely a lack of it. It’s true that construction dropped significantly during the pandemic, but it’s mostly recovered now. The actual issue is that the homes being constructed are frequently not adding additional units.
The statistics you see when looking at construction starts account for all types of construction. However, much of the construction that’s occurring right now isn’t on vacant land. In 2021, 76% of builders reported that the number of available lots is low to very low. In California, a lot of this has to do with zoning laws. Many areas aren’t zoned for multi-family residences or even for residences at all. Even in areas that allow condos or apartment buildings, single-family residences (SFRs) are in higher demand in California. Building SFRs in the right place is also difficult. 28% of SFR construction is reliant on lots called infill sites. While these are vacant land, which is good, they’re in areas that already have a high density of housing and are less in need of additional construction. A further 20% of SFR construction starts come after teardowns, merely replacing one SFR with another SFR.
If you are considering purchasing rental property and also thinking of moving, one possible option is to not sell your home when you move and instead rent it out. There are various pros and cons to doing this, and whether it’s the right option for you will depend on your situation.
The most obvious benefit is that there are fewer transactions involved. You don’t need to list your home for sale and you don’t need to find rental property to purchase, though you may still be purchasing a new residence if you don’t already have somewhere else to move. You may not even need to pay an agent at all — though an agent can still be useful in guiding you to the right choices for your situation. It could also be financially better for you to simply buy once rather than buy twice and sell once. This will depend greatly on several factors, including such things as the market conditions, neighborhood, property size and condition, budget, and mortgage balance. Even if you know you can afford to buy one property, you may not be able to afford to buy two properties and pay off your current mortgage, even with the income from selling.
However, converting a primary residence to a rental property is also a process, especially if you still have a mortgage. If you purchased the property as your primary residence, that was taken into account in your interest rate. The rate is probably lower than if you purchased it as rental property. Because mortgage companies don’t want you to lock in a lower rate then immediately decide you don’t want to actually live there, your mortgage contract may have a stipulation that you must have lived there for a certain length of time to convert it to rental property. Even if you don’t have a mortgage, property taxes are also lower for primary residences. There’s no time restriction on conversions for property taxes, but the rate will change.
Most condominium buildings or planned communities have a Homeowner’s Association, or HOA. The HOA is responsible for managing all of the common areas of the community, including such things as maintenance and gardening. Typically, the HOA is composed of several residents of the community, who collect money from residents — HOA fees — in order to pay specialists for maintenance. Residents usually aren’t required to directly interact with the HOA, but since the revenues they collect benefit the entire community, all homeowners in the community are required to pay HOA fees. In exchange, most of the residents don’t have to worry about routine upkeep.
Declining to participate may prevent your vote from counting when determining where the money goes, though. Except in smaller communities, most residents aren’t on the board of HOA directors. For the most part, HOAs do care about maintaining the community and have good intentions — they probably also live there, after all. However, they may not have the same expertise or connections as you, and it’s theoretically possible that the board members are primarily absentee owners renting out the units. So if you want your voice to be heard, consider joining the board. HOAs are not strongly regulated, so how difficult it would be to get on the board could vary.
One of the statistics used to track health of the rental market is Fair Market Rent, or FMR. By the name alone, one might think FMR is a normative measure that suggests what rent prices should be. Of course, such a measurement would have to take into account construction costs and home prices, but it would also have to take into account the tenant’s income. As a renter, you may be looking for rent prices at or below FMR thinking anything above that is simply a bad deal. But is it actually fair to anyone? Is it even a normative measure at all?
The first question that needs to be answered, though, is: What really is FMR? Well, at its core, it’s a series of vague estimates. The Department of Housing and Urban Development (HUD) calculates FMR on a per-metro basis for five separate categories of homes based on number of bedrooms. Homes with more than 4 bedrooms are excluded entirely. In reality, though, only one category is actually calculated. This is the category for the average home size of 2 bedrooms. The median rent price of 2 bedroom homes, excluding outliers, is averaged over a multi-year period, then the value is multiplied by various ratios to determine FMR for homes of different bedroom counts. Note that this calculation doesn’t factor in either construction costs or income, just rent price, although the price itself generally is indirectly related to constructed costs. This means that if it’s fair to anyone at all, it can only possibly be whoever bought the home. So, no, looking for a rental at or below FMR has no bearing on whether it’s fair to the tenant.
Does FMR perhaps still have some use, though? Though it’s a multi-year average, it’s based on actual rent prices, so maybe it be used to estimate current rent values. It’s a decent assumption, but unfortunately, it’s not actually very good at estimating rent prices. If you’re looking at FMR when considering whether to move to an area, don’t be surprised if your actual rent is far different, especially for multi-bedroom homes. Multi-year averages can’t very easily take into account economic cycles, and broad examinations of metro areas can significantly skew the numbers. Another issue the calculation faces is the notion of rent control. Rent control doesn’t generally happen in an entire metro, so the prices of rent-controlled units are significantly more likely to be taken as outliers and completely dropped. Even if they aren’t dropped, they will skew the median.
For a specific example, let’s take the local area — the Los Angeles metro. This metro area is rather large, and includes multiple cities of highly varied income levels. Despite this, the FMR for the Los Angeles metro is actually lower in every single category than that of the City of Los Angeles. The LA metro FMR for a studio is $1631, quite a bit lower than than actual median rent price for a studio in Los Angeles of $2100, between mid-June and mid-December. The difference only gets larger the bigger the home. The metro’s FMR for 4 bedroom homes is $3377. But the actual median rent of a 4+ bedroom house in LA is $8995, over 2.5 times as much. Considering homes larger than 4 bedrooms to be outliers, as the FMR criteria do, doesn’t do much to help the case for FMR, as the actual median rent is still $7900. The disparity is even greater for higher income regions of the metro, such as the Beach Cities — Manhattan Beach, Hermosa Beach, Redondo Beach, and El Segundo — with a studio median of $2495 and a 4+ bedroom median of $9175. This suggests that high-income units are being excluded as outliers, which isn’t particularly useful if you’re looking to rent in a place such as Manhattan Beach.
Why is FMR lower even for smaller homes, though? Well, there may be a valid reason for that. The actual median data presented here is calculated using information from a Multiple Listing Service (MLS), which is a service used by real estate agents to upload and search listings. Because this is an agent service, only properties listed by an agent will appear in the list. For lower income rental properties, the owner is less likely to use an agent, because they may feel it’s not worth the expense with a small revenue. But the HUD can access that information, which could drag the median down for smaller homes. So, the FMR may be useful to a tenant planning to rent a low-income property. However, remember that the studio FMR isn’t directly assessed, but rather calculated as a ratio of 2-bedroom FMR, so if FMR is more consistent with real values for studio rentals, this is at least partially coincidental and could mean either the 2-bedroom FMR is low or the ratio is off. Moreover, off-market rentals do very little to explain any disparity for larger homes, and especially not such a large disparity.
City National Bank, based in Los Angeles, was accused of refusing to underwrite mortgages in predominantly Black and Latino communities. The Justice Department alleged that this occurred between the years of 2017 and 2020. They used two major pieces of evidence: First, other banks operating in the same areas with predominantly people of color received six times as many mortgage applications during this time period. Second, of the 11 branches City National opened in the past 20 years, only one was in a neighborhood with predominantly people of color, and this branch did not have a designated underwriter. While it’s theoretically possible that City National Bank simply doesn’t have many customers that are people of color, discrimination is a likely reason for that.
While City National Bank denied the Justice Department’s allegations, they seemed cooperative with the investigation. They claimed that they supported efforts to ensure equal access and readily agreed to a settlement. The terms were a $29.5 million loan subsidy fund for Black and Latino borrowers as well as an outreach campaign costing $1.75 million. The 31.25 million dollar value makes this the largest settlement ever for the Justice Department.
We’re taking a little different approach with this post. Because it’s not only the end of the month, but the end of the year, we’re doing a quick summary of the monthly data, followed by some more detailed discussion of how the individual areas have fared over the past year. We’ll even try some crystal gazing while we walk through the annual data for each neighborhood.
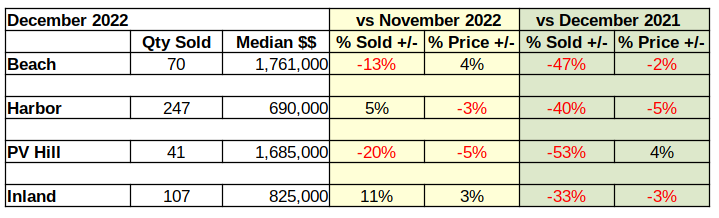
This is a great place to bring in our At A Glance table. It displays in just a few numbers how all the areas of the LA South Bay are doing compared to last month, and compared to this same month last year.
Looking at December vs November, once again the percentage of unsold homes has increased and the number of homes sold below last month’s median price has also marginally increased. More importantly, on a year over year basis the amount of red ink is even greater. Losses in number of sales and in the value of those sales is clearly growing.
Despite all the negative numbers, there may be a light in the future. For the past couple weeks we have observed a softening in the mortgage interest rates. If that turns out to be more than a mid-winter teaser rate, this spring may shine a bit brighter than previously anticipated. We’re not holding our breath though. Recent speeches from Federal Reserve Bank leaders have stated a clear intent to “hold the line” on driving down inflation with mortgage interest rate increases.
Beach Cities Home Sales Down 47%
Compared to 2021, fewer homes have been sold in the Beach Cities every month of 2022 than the same month the previous year. January started the trend with a decline of 28% versus the number of homes sold in 2021. That difference continued to increase all year. By December sales were 47% lower than the previous December.
As the interest rates climbed, the number of home sales dropped. Looking at the total sales volume for the year, 35% fewer homes were sold in the Beach area during 2022, than were sold in 2021. Of course, 2020 and 2021 were the highly erratic pandemic years. So, looking into sales at the Beach for the last few years we find the number of homes sold has already dropped 21% below the number sold during 2019, our last normal economic year. Effectively, the Covid-19 pandemic created. Then erased any gains of the past three years at the Beach.
Homes sold in: 2019 – 1572 (market normal) 2020 – 1572 (market direction down six months, up six months) 2021 – 1910 (market direction down two months, up ten months) 2022 – 1242 (market direction down twelve months)
While the Beach Cities suffered the largest drop in sales volume for 2022, the South Bay as a whole has also dropped below the sales figures for 2019.
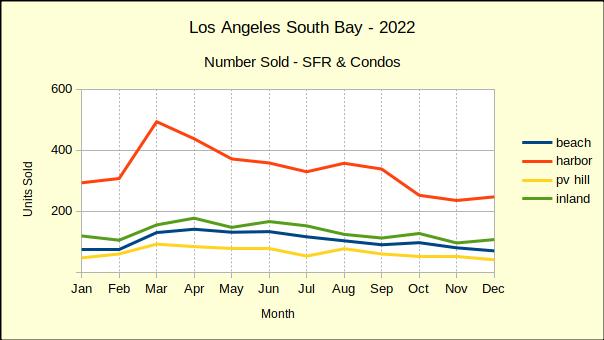
Sales Volume Down Across the Board
All areas started the 2022 year down from the prior month and down from the same month in the prior year. February results were mixed with the Harbor and Palos Verdes areas showing stronger results. March sales jumped up as buyers realized the rising interest rates were about to price them out of the market. From April on, sales volume across the South Bay was trending down on a year over year basis.
In sheer number of sales, the Harbor area fell the farthest. In 2021 annual sales 5292 homes were sold in the Harbor cities, while in 2022 the number dropped to 4017. That amounted to only a 24% decrease compared to the 35% annual collapse in the Beach areas.
On a month to prior month measure, sales declined six months out of nine across the South Bay. Occasionally one or two areas would post a positive sales month, but in the end, 2022 showed a 26% drop in sales volume from 2021 across the South Bay.
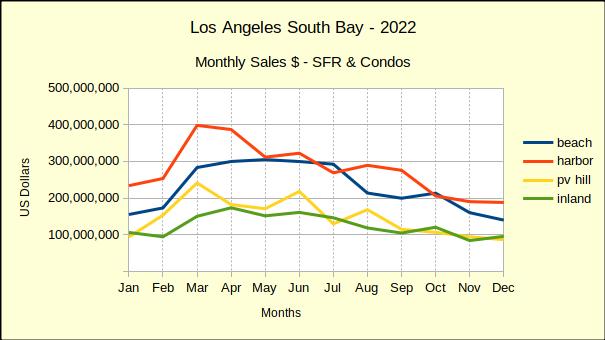
Sales Dollars Diving
With the number of sales dropping in a range of 25% to 50% it’s not a surprise to discover the total dollar value of those sales has taken a dive. As the chart below shows, the first quarter of the year was generally positive, then reality set in and the buyers started walking away. The rest of the year was little more than a measure of the recession.
Monthly revenue in the Harbor area alone dropped $200 million between March and December. The Beach cities and the Palos Verdes area lost about $150 million a month in sales value. Inland area sales for the same period are off approximately $75 million.
One should consider these declines in the context of the pandemic. Early on, while much of the world was in lockdown, the government flooded the citizenry with easy money, hoping to keep the economy afloat. Mortgage interest rates were already at the bottom because the economy was just recovering from the last recession. The result was a real estate boom starting in summer of 2021, which continued until March of 2022.
The housing market is now in the “bust” part of the cycle and we anticipate it to last through 2023. Gross sales across the South Bay jumped up from $8 billion in 2019 to $12 billion in 2021. That’s clearly unsustainable, especially from the perspective of a Federal Reserve System which is looking for 2% growth. So far the market decline has taken back about 23% of that $4 billion bubble.
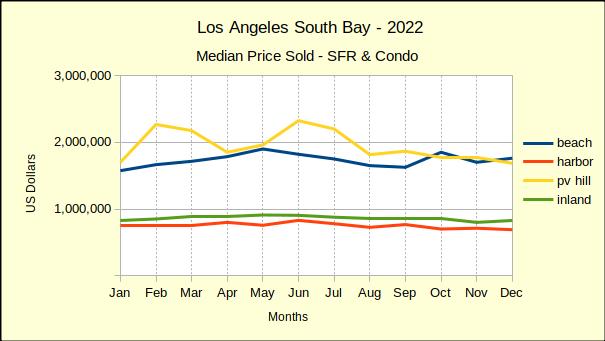
Median Price Is Slipping
There is a lull between when buyers stop buying and prices start dropping. Most sellers need to see headlines about the market change before they make a price reduction. Median prices started to slide in August at the Beach and on PV Hill. The year ended with most areas having experienced multiple monthly declines in the median price. Despite that, median prices still exceeded those of 2021 by roughly 7%.
Comparing 2022 to 2019 better shows the inflation factor. Generally speaking the South Bay ended the year with median prices 30%-35% higher than they were in 2019.
The Palos Verdes market is comparatively small, thus is typically volatile on a monthly basis. The yellow line on the chart above shows the range of high and low median prices. Since mid-year the median price has drifted down and merged into the downward trend.
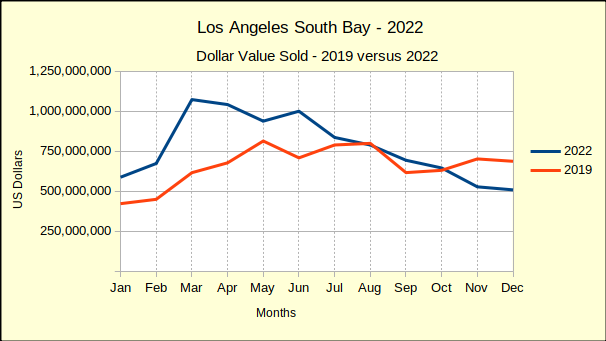
Year End Versus 2019
We’ve been comparing 2022 to 2019 all year because real estate sales during the height of the pandemic were so out of the ordinary, regular year over year comparisons yielded untenable results. The chart below depicts the current year total sales for the South Bay compared to sales from 2019.
Tracking the blue line, one can see where sales dropped below 2019 values in August, recovered in September, then slipped below again for the fourth quarter of the year. December sales didn’t fall quite as far as projected, but still came in about $200 million less than December of 2019.
The end of the year reflected accumulated sales of approximately $9.3 billion. That would mean 2022 total dollar sales come in at $1.3 billion above the $8 billion total dollar value sold in 2019. Across the South Bay that was an 18% increase.
Broken out by community, we found total dollars sold in the Beach cities to be 4% above 2019, followed by the Inland area with a 20% increase. Harbor came in next with a 21% increase and the PV Hill with a 35% increase.
We expect both sales volume and median price to continue declining through most, if not all, of 2023. By mid-year of 2024 there should be evidence of the beginnings of a recovery.
Disclosures:
The areas are: Beach: includes the cities of El Segundo, Manhattan Beach, Hermosa Beach and Redondo Beach; PV Hill: includes the cities of Palos Verdes Estates, Rancho Palos Verdes, Rolling Hills and Rolling Hills Estates; Harbor: includes the cities of San Pedro, Long Beach, Wilmington, Harbor City and Carson; Inland: includes the cities of Torrance, Gardena and Lomita.
Data from December 2022 shows us that home prices in California are unquestionably going back down. December 2022’s median home price of $774,580 was just barely below November 2022’s median price, only by 0.4%. This isn’t necessarily a trend, but what is a trend is that it’s 2.8% below prices at the end of 2021. Home prices are down in every major region of California, and across both single-family residences and condos. However, all regions except for the San Francisco Bay Area had at least one county experience price growth.
The far northern regions of California had the most notable shifts. Year-over-year, prices are down a whopping 41.8% in Lassen County. Granted, this isn’t a massive dollar value given that Lassen County is the least expensive county in the state, with a median home price of just $170,000 in December 2022. Even so, it was actually the third cheapest at the end of 2021 — both Del Norte County and Siskiyou County were cheaper in December 2021, but both actually experienced price growth this past year. In fact, Del Norte was the county that had the most significant price growth at 13.8%. Del Norte and Siskiyou counties both border Oregon, and Lassen County is just south of Modoc County, which also borders Oregon but is not included in the rankings.