October is the turning point where the heat and excitement of summer cools, the children are back to school–in person this year–and the real estate market starts to button up for the winter. Being SoCal as we are, we don’t button up as much as most of the nation, but things do slow considerably between Thanksgiving and New Year’s Day.
We’re seeing normalcy appear more and more often, now that the pandemic is winding down. During the first quarter of 2021 we watched month-over-month volume changes ranging from a 33% decline to a 69% increase. Seeing some of the monthly statistics moving back into the single digits is highly encouraging.
Throughout this year we have essentially ignored the comparison of 2021 to 2020. The “Lost Year” of 2020, compounded as it was with the pandemic and what was anticipated to be a minor recession, has been a nightmare in terms of short term business projections. Trying to understand where the real estate market is headed, we have resorted to comparing two or three month trends, which is more or less like playing the slots.
Now in the fall of the year, looking at slower winter months ahead, rationality seems to be returning in the statistics we’re seeing–not all– but, most.
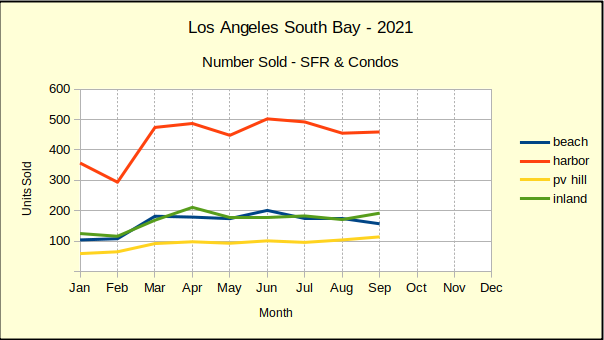
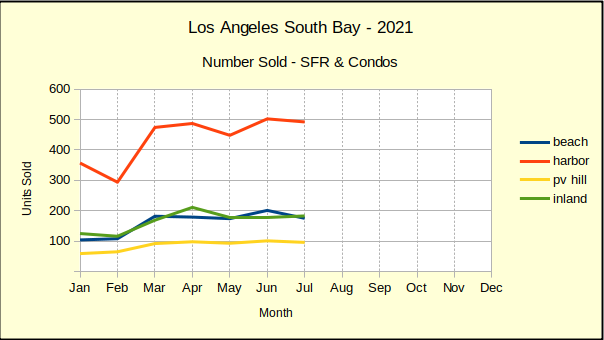
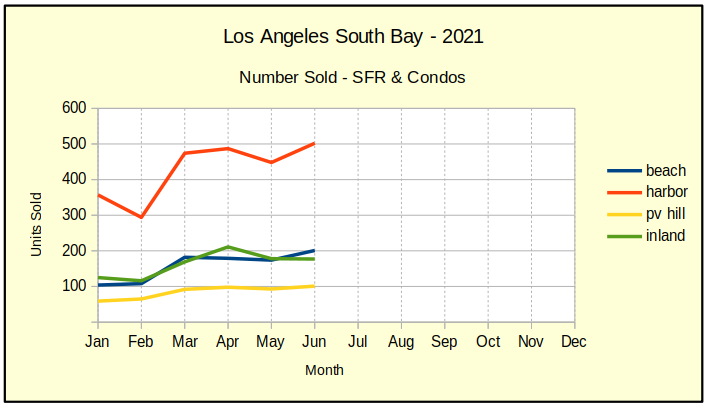
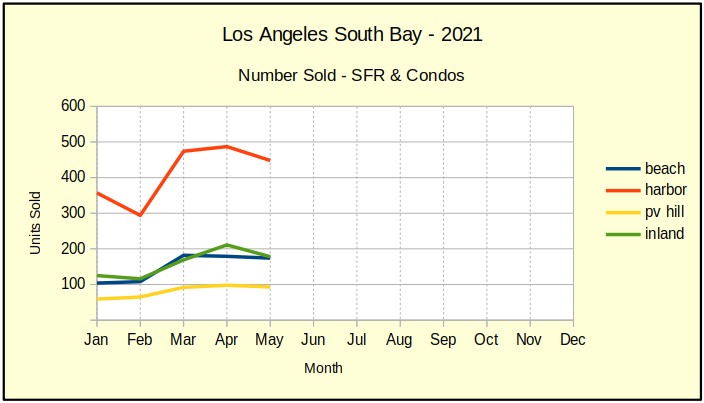
Sales Volume – Some Down, Some Up
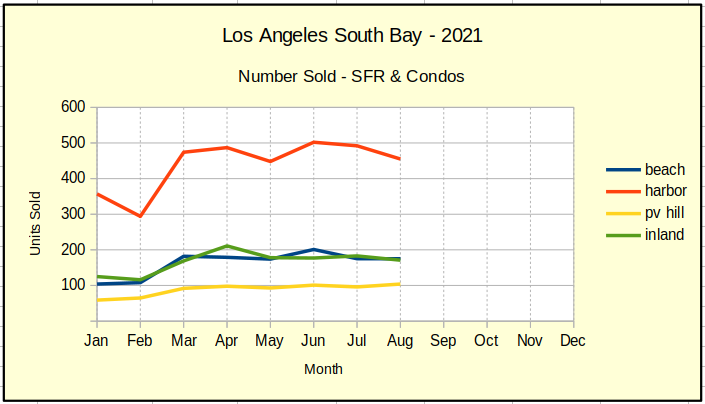
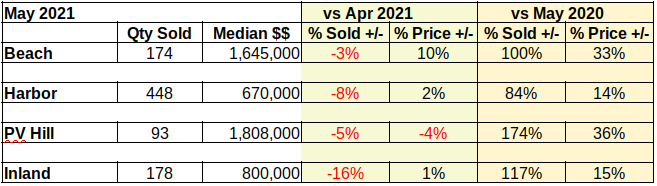
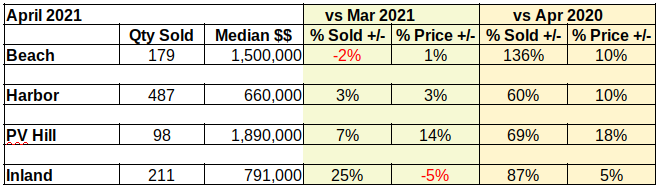
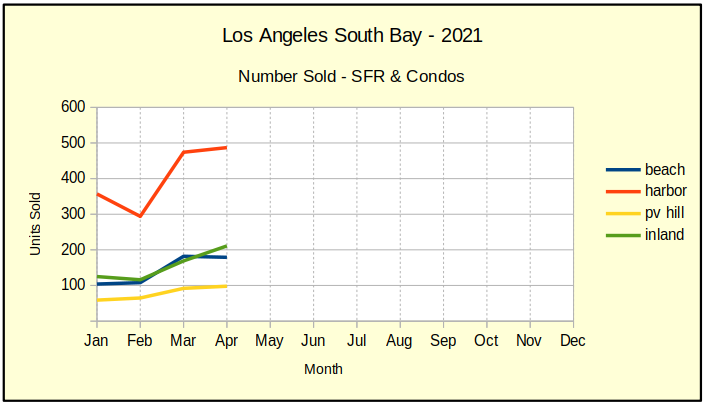
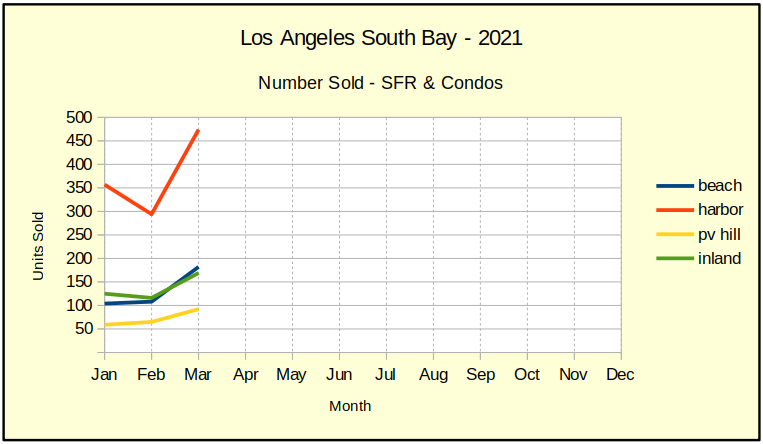
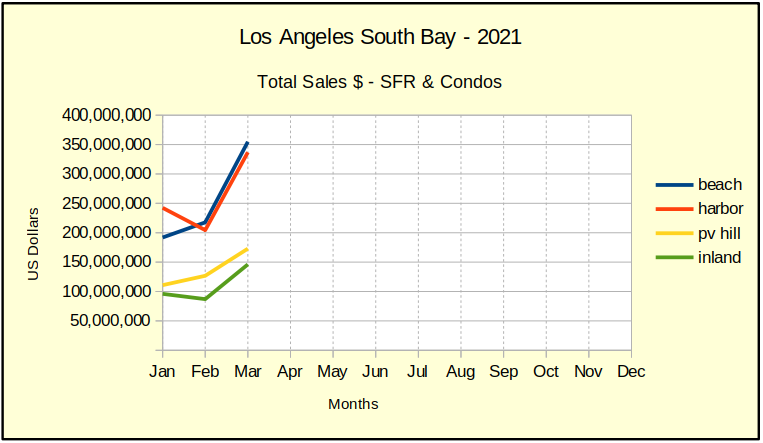
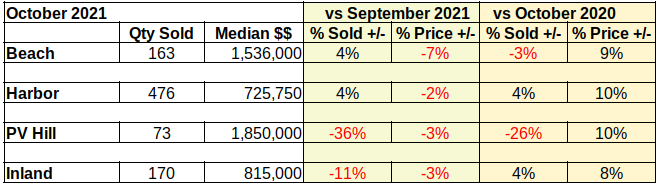
As we can see by the yellow line in the chart below, Palos Verdes sales volume took a big dive this month. The Harbor was up, the Beach was up, but the inland was down and sales on the PV Hill was way down.
We’re not able to see any outstanding reason for the 36% drop in the number of homes sold in PV for October versus September. Similarly, the Inland area loss of 11% in the number of units sold during October, is inexplicable. But then, much of what we’ve experienced in the time of Covid has been lacking in explanation. For good or bad, we’re adapting to dramatic shifts in the world.
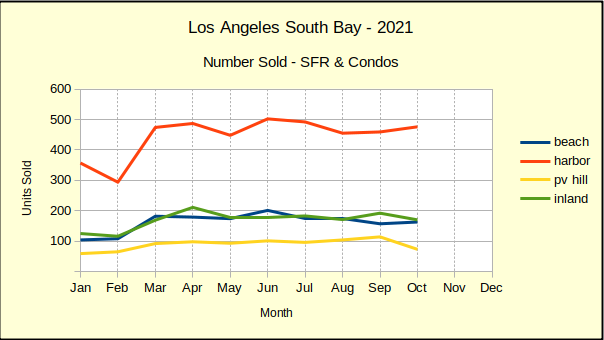
By comparison to Palos Verdes, the Beach which has been losing sales volume since mid year, turned up for the month, increasing the number of homes sold by 4%.
The chart shows the Harbor area having the greatest variance in month-to-month sales numbers during the first half of the year. Since June the shifts have been more gentle.
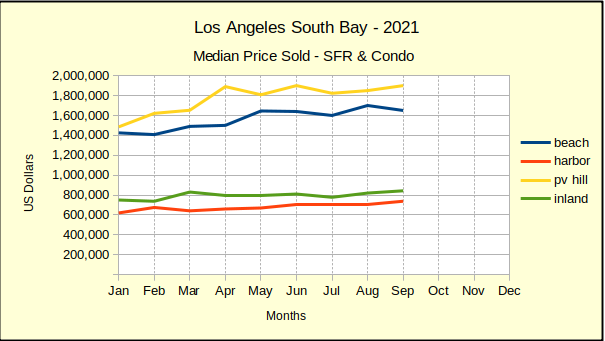
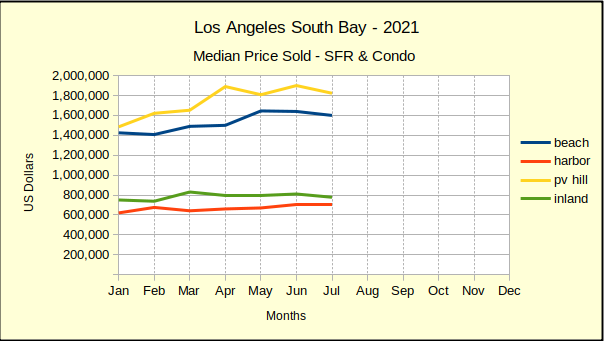
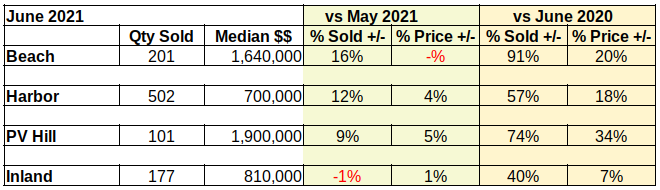
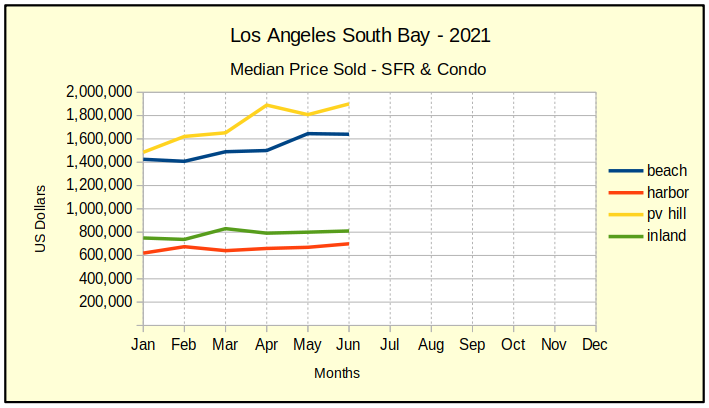
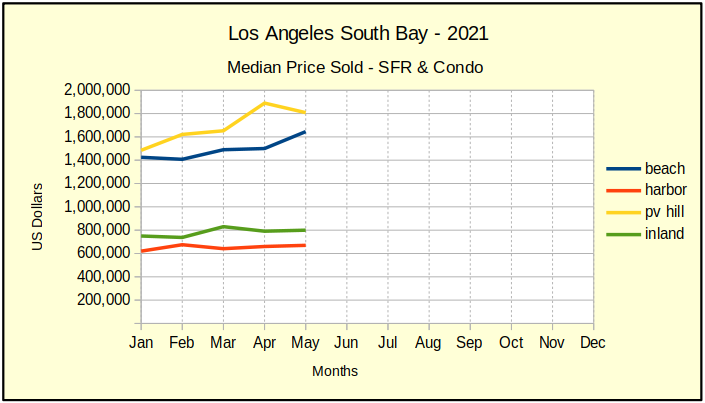
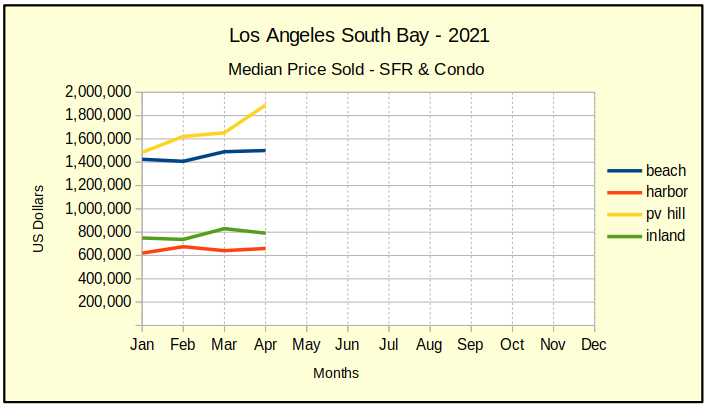
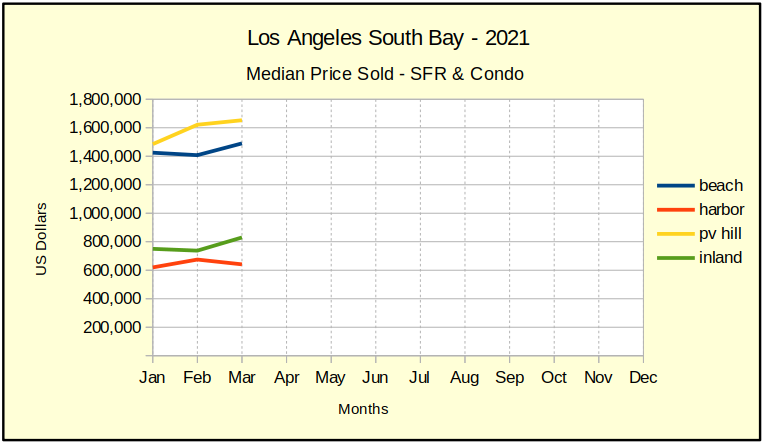
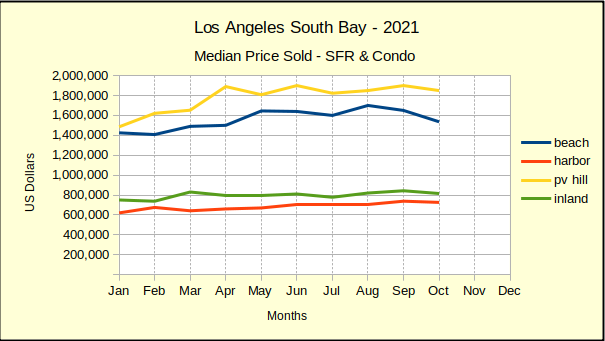
Median Price – Down Everywhere
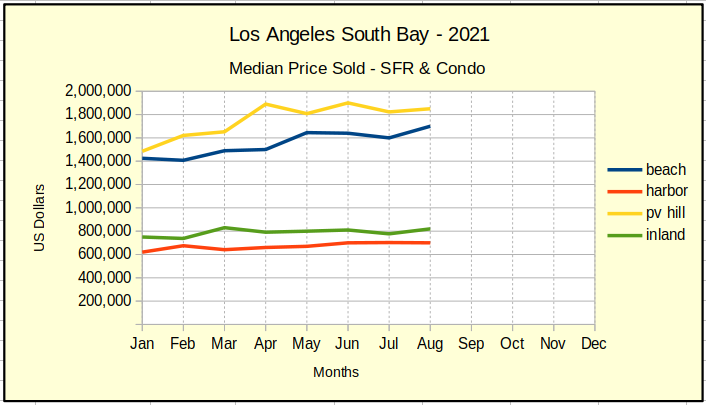
October brought a decline in the median price of sold homes in all four segments of the market. The Beach Cities dropped another 7% this month, after having fallen 3% last month.
From a broad perspective, two things are happening. The mundane answer is the time of year. It’s fall and it’s often possible to get a better deal in fall or winter because there are fewer buyers competing in the market. The size of these percentages imply there are more than seasonal reasons.
A more exotic explanation involves the underlying motivation for the steep increases in price from May of 2020 to June of this year. Those prices were reactions to the low interest rates combined with a persistent shortage of available homes. Bidding wars drove prices up at rates that aren’t sustainable. Forecasts call for as much as a 15% overall increase in median prices at the end of the year. A typical year will be closer to 4% inflation, so as mortgage interest rates increase (they’re over 3% as I write this) we’ll have downward pressure on prices.
At the same time, Federal loan forebearance related to Covid ended September 30. Nationwide projections indicate approximately 17% of owners who were in forebearance are currently unable to make payments and don’t have a plan. Another 7% have a plan. They plan to sell. Nationally, we could see 20% of a million homes added to the inventory in coming months.
Locally, we’ve seen a handful of pre-foreclosure and foreclosure properties come on the market. Currently there are 4 Active, and 8 In Escrow, with 13 Sold in the past six months.
All of which is to say we forecast a correction in prices.
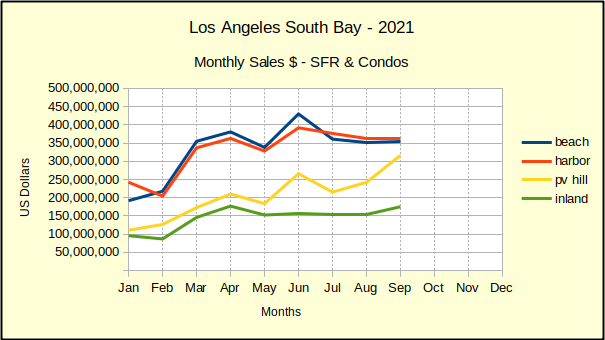
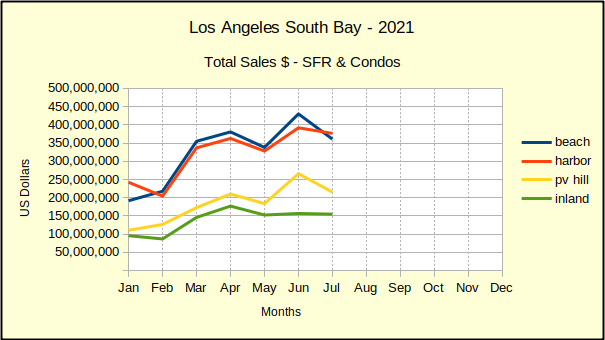
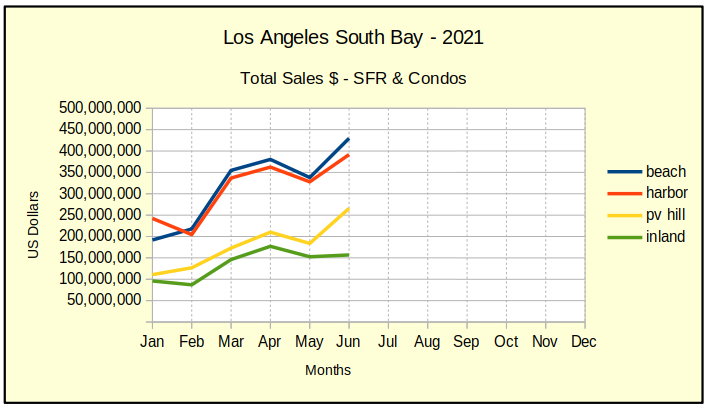
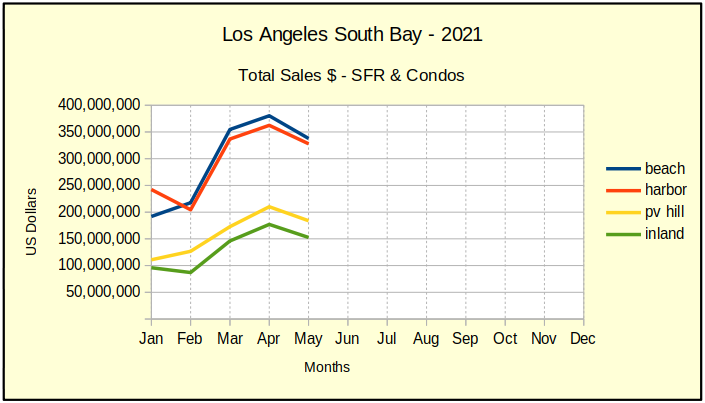
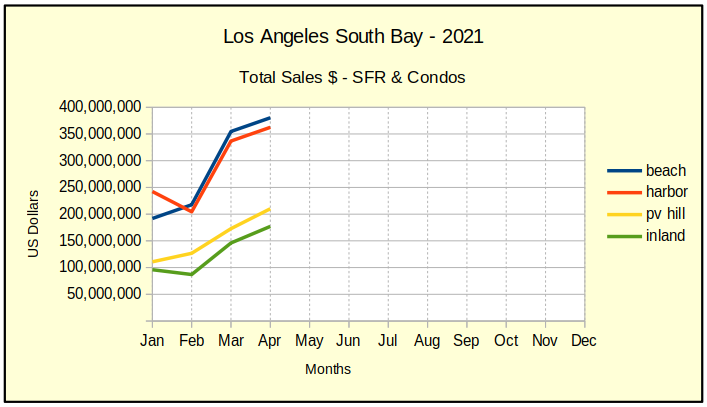
Total Sales Dollars – A Big Dive for PV
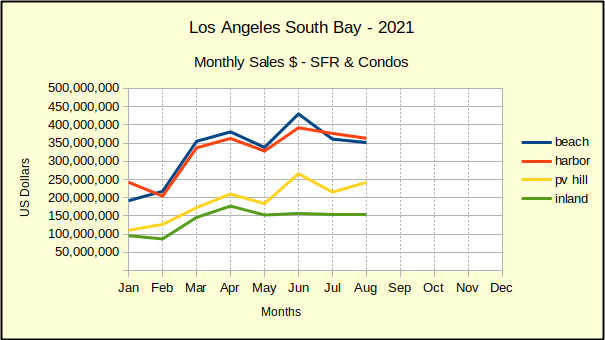
Look at the yellow line in the chart below! October saw a noticeable drop in Palos Verdes volume. Here, we see that convert to a sharp decline in cumulative sales dollars. A drop in median prices from September to October multiplied by a decline in the number of hones sold resulted in a $150M drop in total sales for the month. By comparison, the other areas showed mixed results, with moderate numbers.
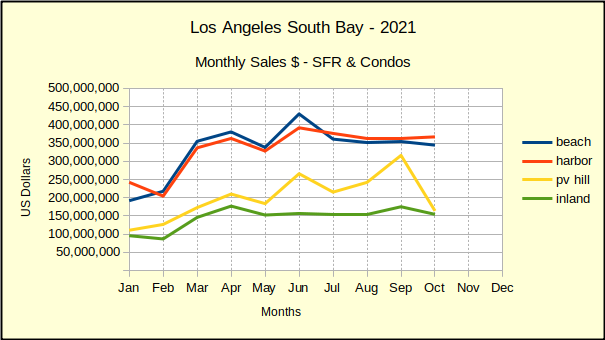
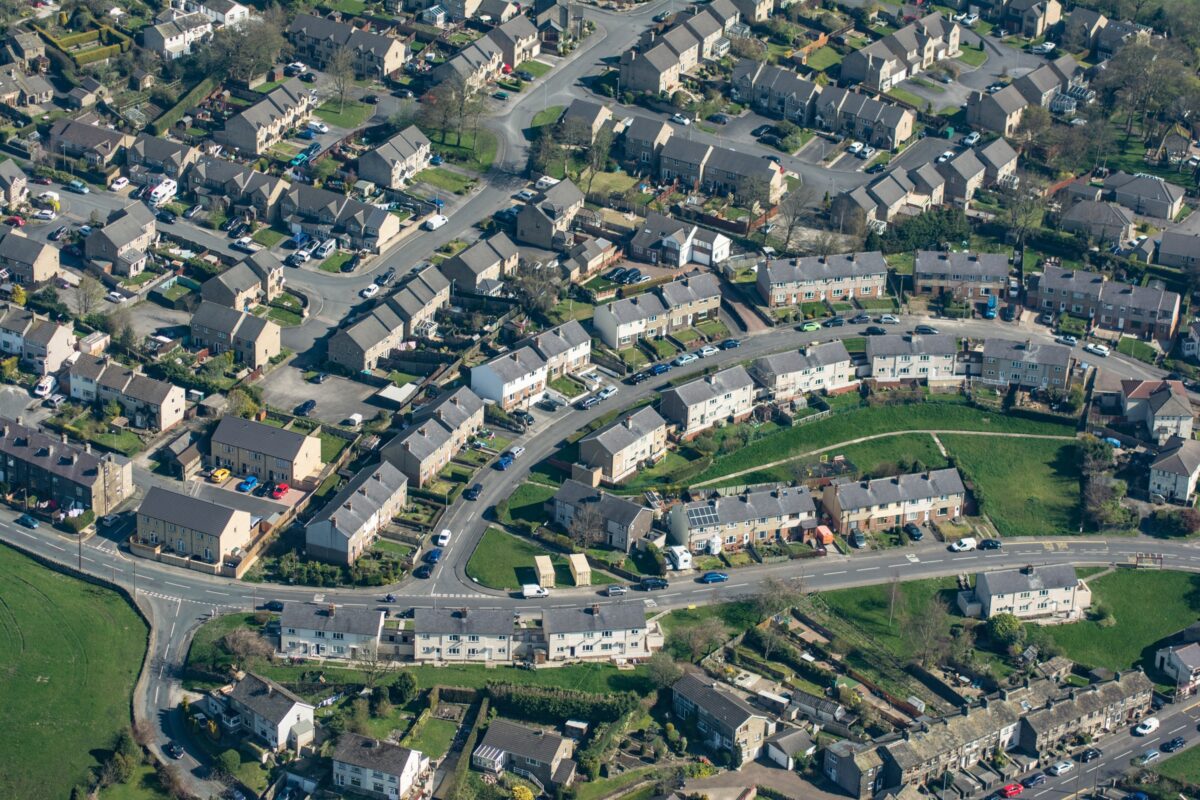
This is a good time to remind readers that these four broad categories we use for this analysis are defined by the type of housing predominantly found in the area. As a matter of geological necessity, there are fewer homes at the Beach and on the Hill than there are Inland, or in a Harbor city. Probability dictates that we occasionally have statistical results that look dramatic, but are simply an anomaly resulting from the small number of homes we’re dealing with in any given month.
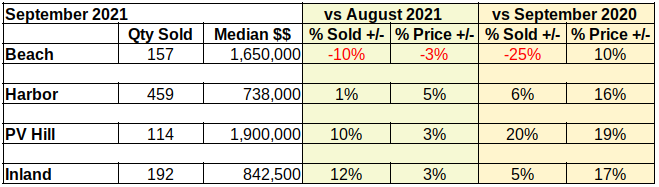
The Summary
We expect 2021 to leave us with a solid real estate market, albeit with some correction to inflated median prices, The October vs. September numbers clearly show some price resistance. Sales volume is mixed, showing some hesitance to buy on the Hill or Inland. The Beach Cities and Harbor areas both still show ready, willing and able buyers.
We wish everyone a Happy Thanksgiving and a wonderful Holiday Season!
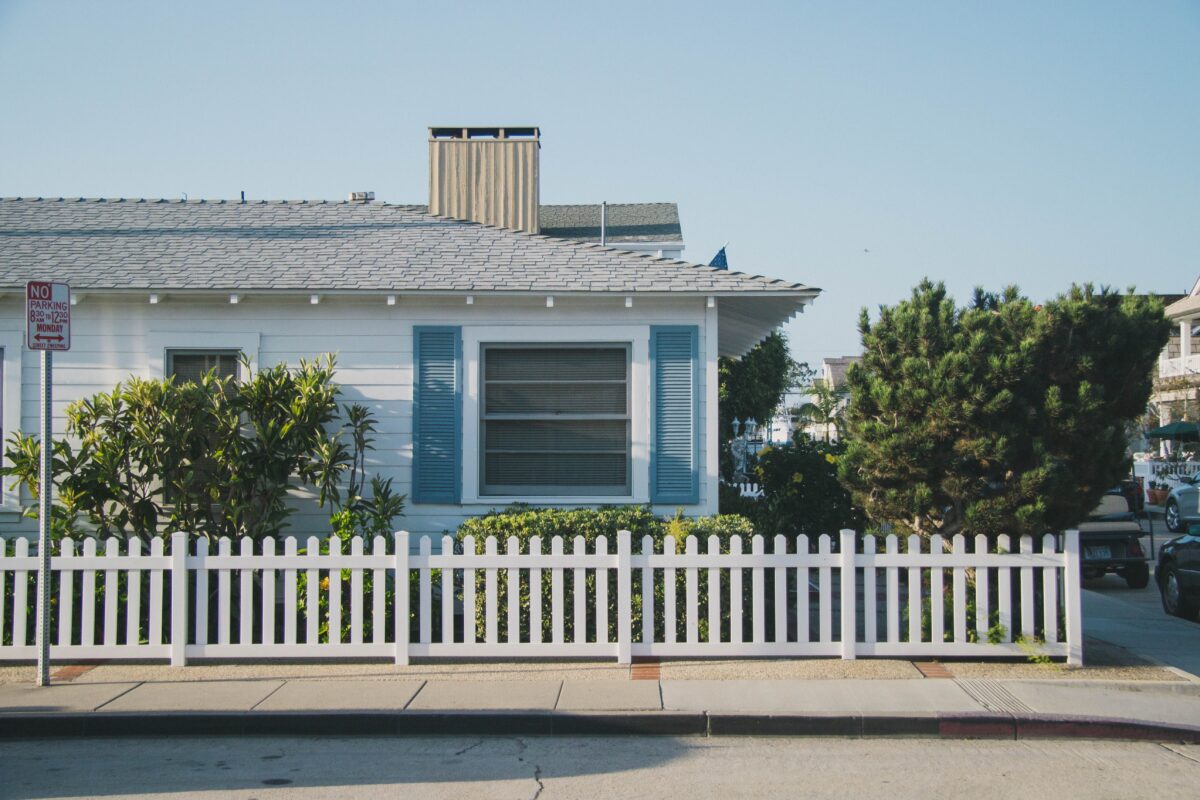
Main photo by Julianne Takes Photos on Unsplash