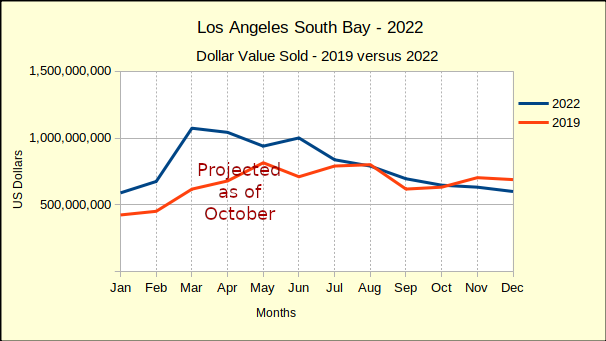
Median Home Prices Falling
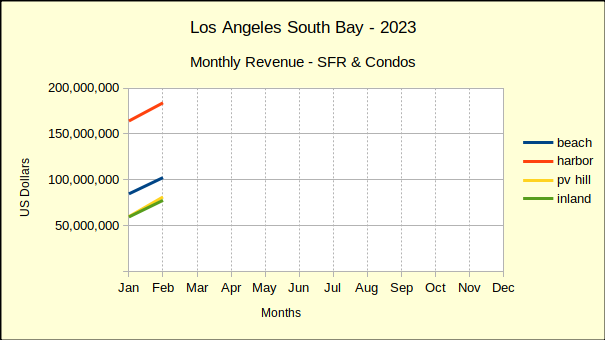
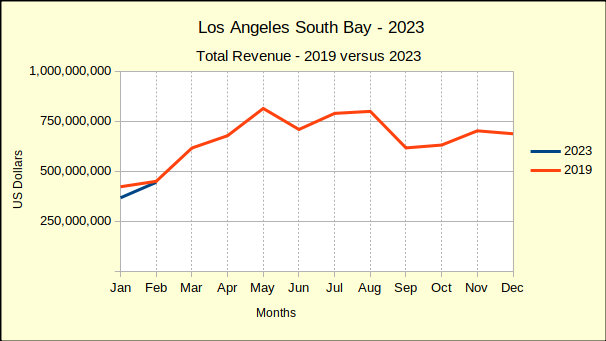
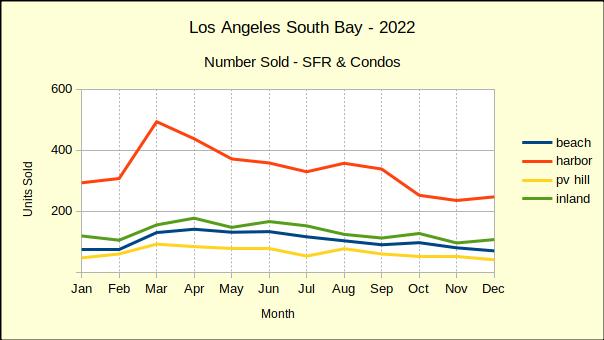
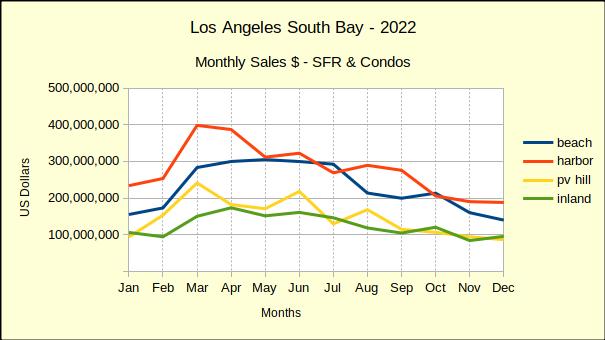
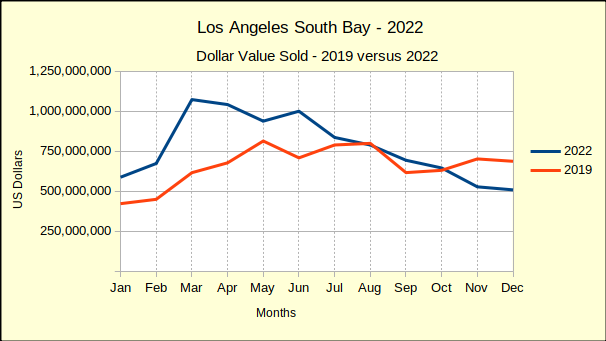
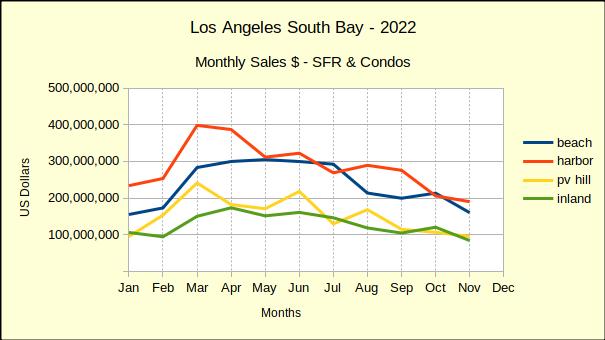
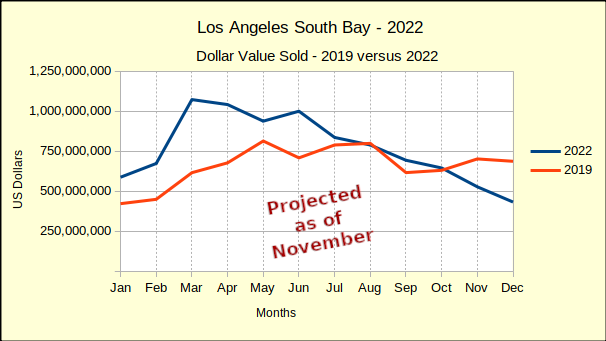
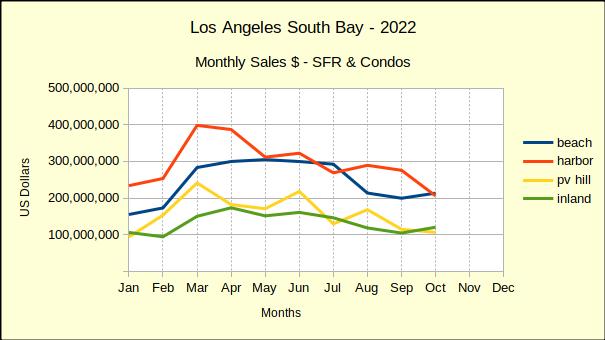
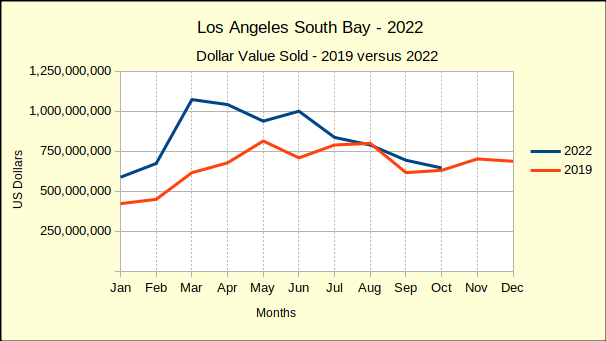
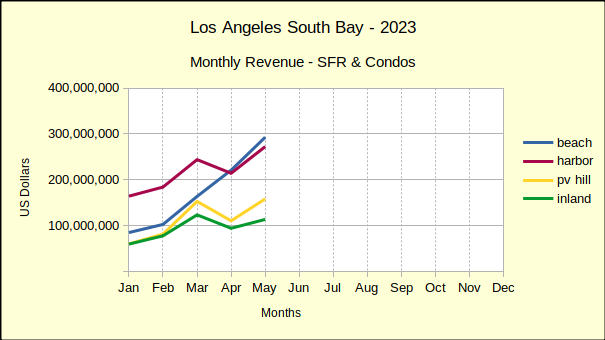
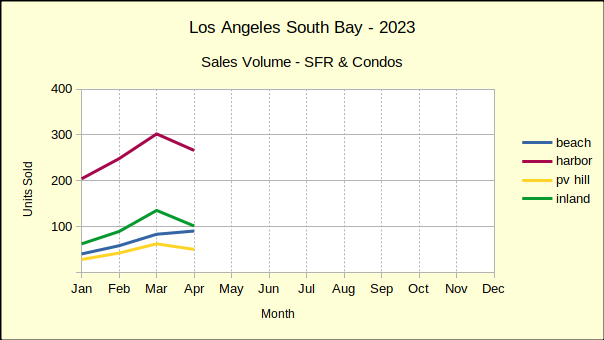
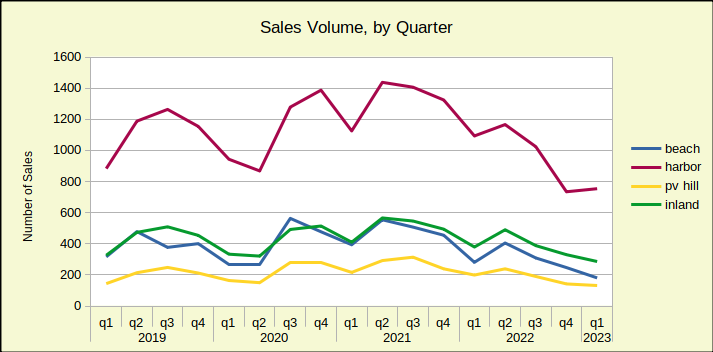
Year to date through July, the gross revenue for South Bay is a mere 3% above that of 2019. At the same time, sales volume, the number of homes sold, is 23% below the sales of 2019. By most standards, 2019 was the pinnacle of real estate business prior to the turbulent years of the Covid pandemic.
Many sources compare current business to that of the pandemic years, partially because it’s easy and partially because the “numbers look better.“ Undeniably, the statistics do look more favorable, however, this analysis takes comparisons beyond the normal “last month” and “same month last year” to include 2023 versus 2019. This allows our readers to see 2023 in a historical context and to more readily recognize the unfolding recession.
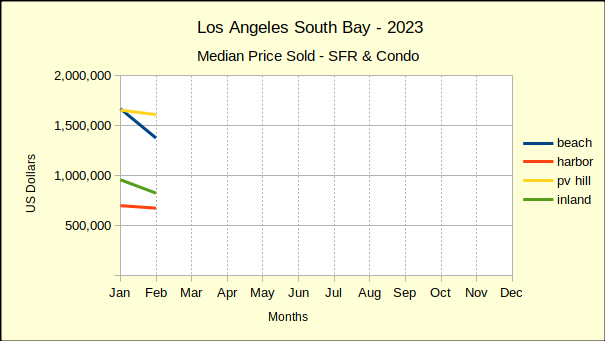
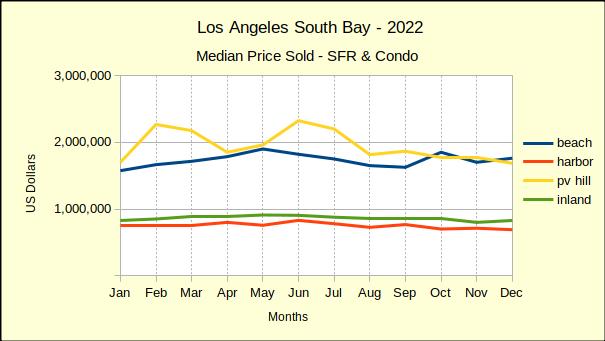
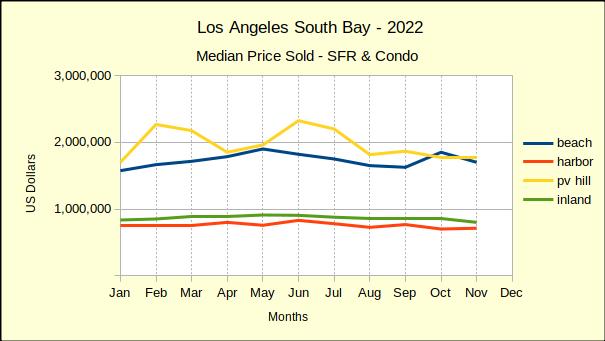
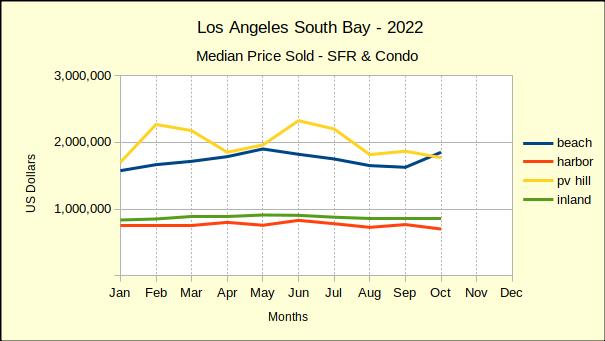
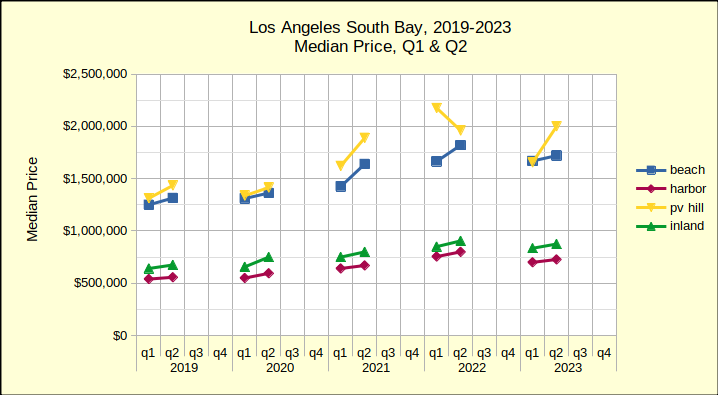
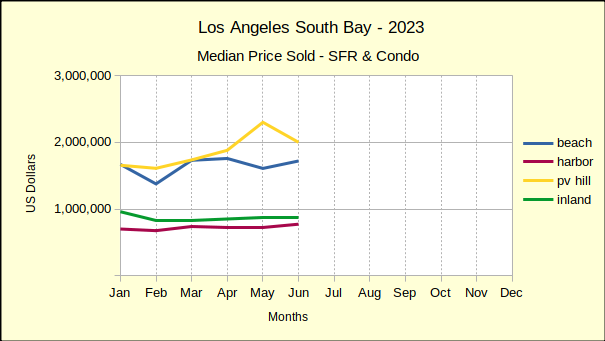
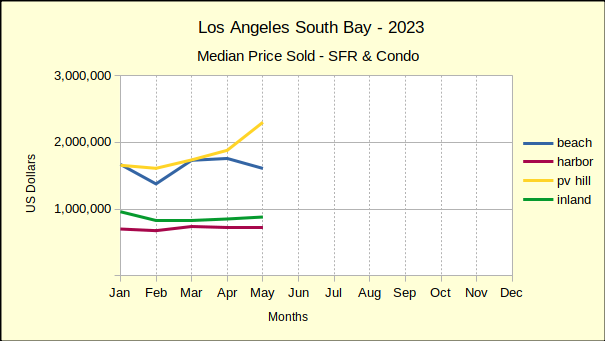
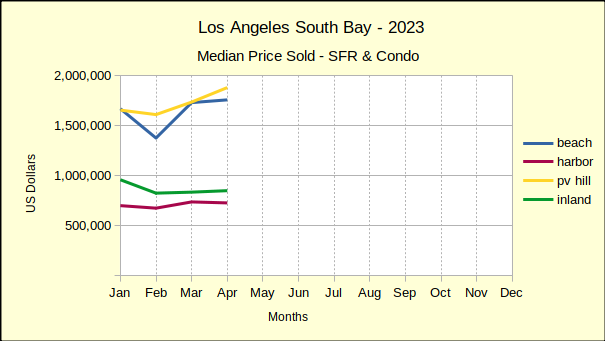
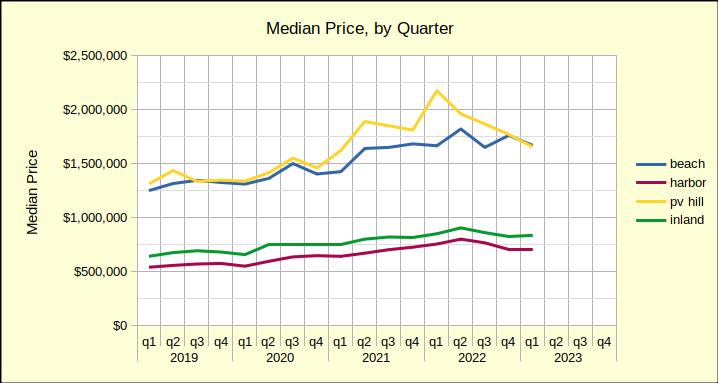
While median prices are still above those of 2019 right now, we project the median prices will also drop below the 2019 level before this recession ends. On a month to month basis, prices are falling approximately half the time. On a year to year basis, 2023 prices have dropped below 2022 medians 82% of the time. Median prices for June and July of 2023 fell below 2022 in all four areas both months. Buyers and sellers should anticipate the bottom of the recession in late 2024, or possibly 2025. Normal growth should return in 2026.

The July report from the Federal Reserve Bank (Fed) notes that inflation is expected to continue above the target of 2% through 2025. Accordingly, the Fed efforts to “restrain” the economy (meaning increase interest rates) will continue into 2025. The report indicates that while housing costs are slowing, they continue to increase at inflationary levels, necessitating further reduction.
In the meantime, buyers who are financially able should plan to acquire desirable properties at substantially better prices than will be available after recovery begins. Sellers who anticipate a need to sell before the economic turn-around, should look toward selling sooner rather than later, to minimize the impact of the down-trending market.
Beach Cities Summer Market Fizzles
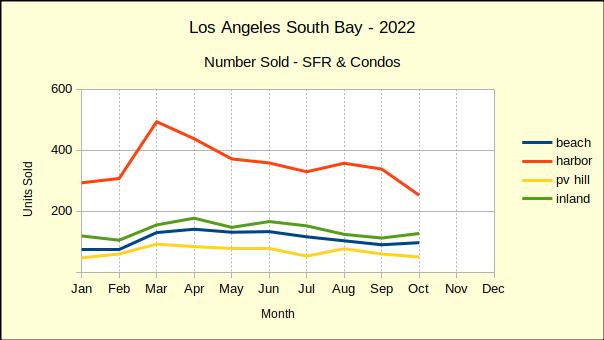
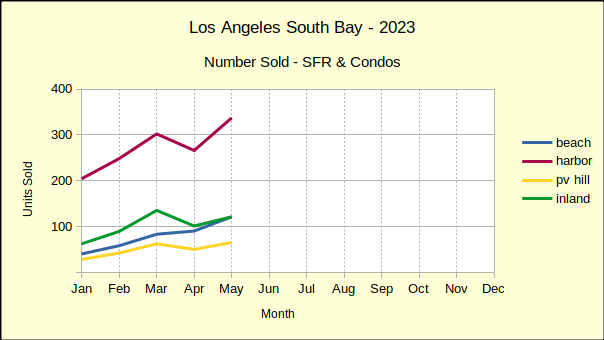
From June to July the number of homes sold in the Beach Cities fell 27% and those sold for a median price of 2% less. Some of the decline in sales is attributable to fewer homes available, as sellers hold properties off the market in hopes of improving conditions. Even more is a result of buyers who have lost significant purchasing power as mortgage interest rates have rocketed to over 7%.
Compared to July of 2022, the number of homes sold this July dropped 22% with a decline in median price of 4%. This set of statistics is somewhat deceptive in that last July the real estate market was still in the early stages of the downturn. As the current year progresses, year over year figures will demonstrate the slide more clearly.
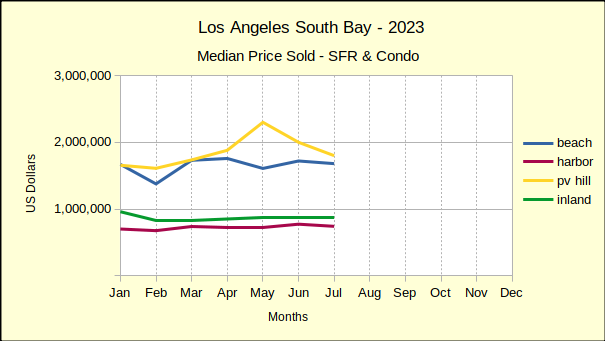
Comparing the first seven months of 2023 to both 2022 and 2019 (the most recent year of business not impacted by the pandemic) shows the drift of sales and prices. The number of homes sold fell 24% from 2022 (802 homes) to 2023 (607 homes), while it was down 35% from 2019 (930 homes). The Fed dropped mortgage interest rates to essentially zero during the pandemic to keep the general economy afloat, which resulted in rapid price escalation which ultimately made purchasing a home unaffordable for about 25% of potential buyers. Then to control the resulting inflation, the interest rates jumped up around the 7% mark, which further slowed the real estate market by “pricing out” another 10-15% of buyers. With fewer buyers and stagnating prices, sellers are reacting by pulling property off the market and delaying planned sales.
Median prices fell 4% from 2022 and are still 28% above the median price of Beach Cities homes in 2019.
Harbor Area Sales Volume Plummets
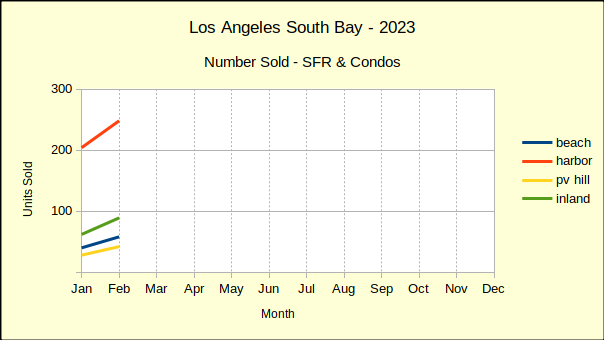
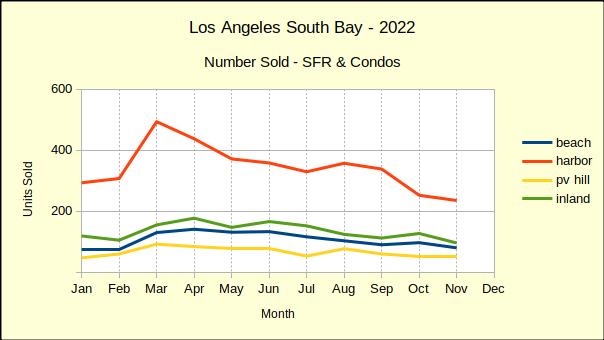
Sales volume in the Harbor area has held up better than the Beach, possibly because median price has taken a greater hit. On a monthly basis, 24% fewer homes were sold (269 in July versus 353 in June). Comparing July of 2023 to July of last year, only 18% fewer closed escrow (269 versus 329).
Generally being an entry level market, the Harbor area tends to react faster to changes in market condition. More upscale neighborhoods frequently “stick to the price” for a longer period of time when markets are declining. Month to month median price dropped 4% in July to $565K. For July of 2022 versus July of 2023, the median fell 5%, from $780K to $740K.
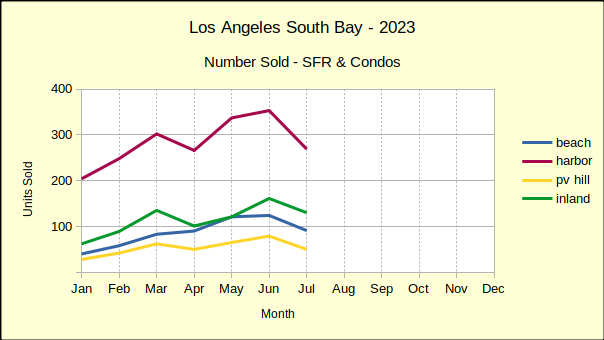
Year to date through July, sales volume was off 24% from last year. Median price was down 4% when compared to the same period in 2022. Looking back to 2019, the number of homes sold during the first seven months of 2023 dropped by 21%. Median price for the same time frame shows up at 32% higher than 2019. Given the median price dropped 4% over the past month (from $772K to $740K), it’s reasonable to project the Harbor area median will end the year near $600K, as it was in 2019.
PV Hill Shows Volatility
Month over month, the number of homes sold on the PV Hill fell from 79 units in June to 50 in July, a decline of 37%. At the same time, the median price dropped 10%, ending the month at $1.8M. This despite a high sale of $12.5M, up from the high of $10M in June.
Year to year, July volume dropped 6% from 53 units in 2022, while median price plummeted 18%, from last year’s $2.2M. Palos Verdes is a unique community with large homes on large lots, many of them highly custom. Combined with the small overall number of homes, these properties truly need to be assessed on an individual basis for realistic projections.
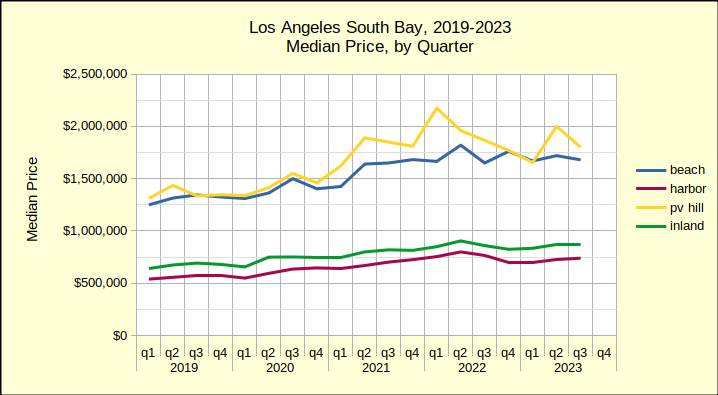
Comparing cumulative sales data for January through July, volume is down 23% and median price is down 17% versus last year. Going back to the stable year of 2019, the number of sales is down 16% while the median is up 34%.
Interestingly, if the Fed’s annual 2% inflation target is added to the years between 2019 and 2023, the median on the Hill would be $1.5M today, instead of $1.8M. Under those circumstances, it would only take a decline of $300K to erase all gain from the past three years. Not a comforting thought for anyone who purchased recently.
Inland Cities Most Stable
The Inland area typifies a classic “middle of the road” performance in the real estate world. Generally the homes are everyday family properties, the sales trends are at the middle of the current South Bay market, and everything seems to happen with minimum drama. So there is little surprise at the minimalist 19% decline in monthly sales volume, the lowest of the South Bay. Likewise there is no shock the Inland cities came in with the lowest monthly price decline, a mere 1% below June.
Similarly, the annual sales volume showed July of 2023 only 14% below last July and the median price just 1% below the same month a year ago.
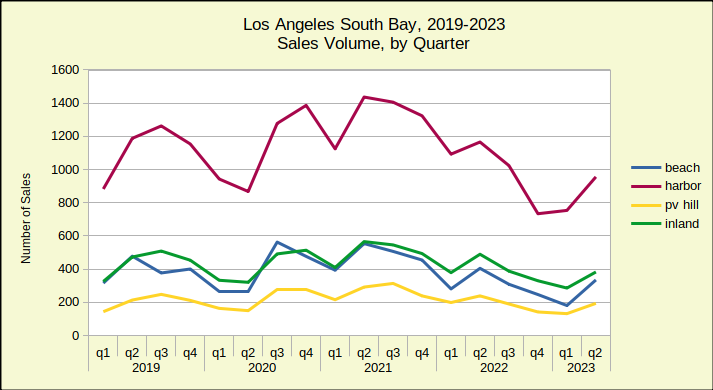
Year to date for the first seven months of 2023 compared to 2022 looks much the same. The number of homes sold dropped by 22%, 799 in 2023 versus 1021 last year. The median price fell 2% to $868K from $883K. Looking back to the 2019 sales volume for the same time period, the Inland area is off by 18% for the current year. Much like the rest of the South Bay, the median price in 2023 ($868K) remains above that of 2019 ($662K) by 31%.
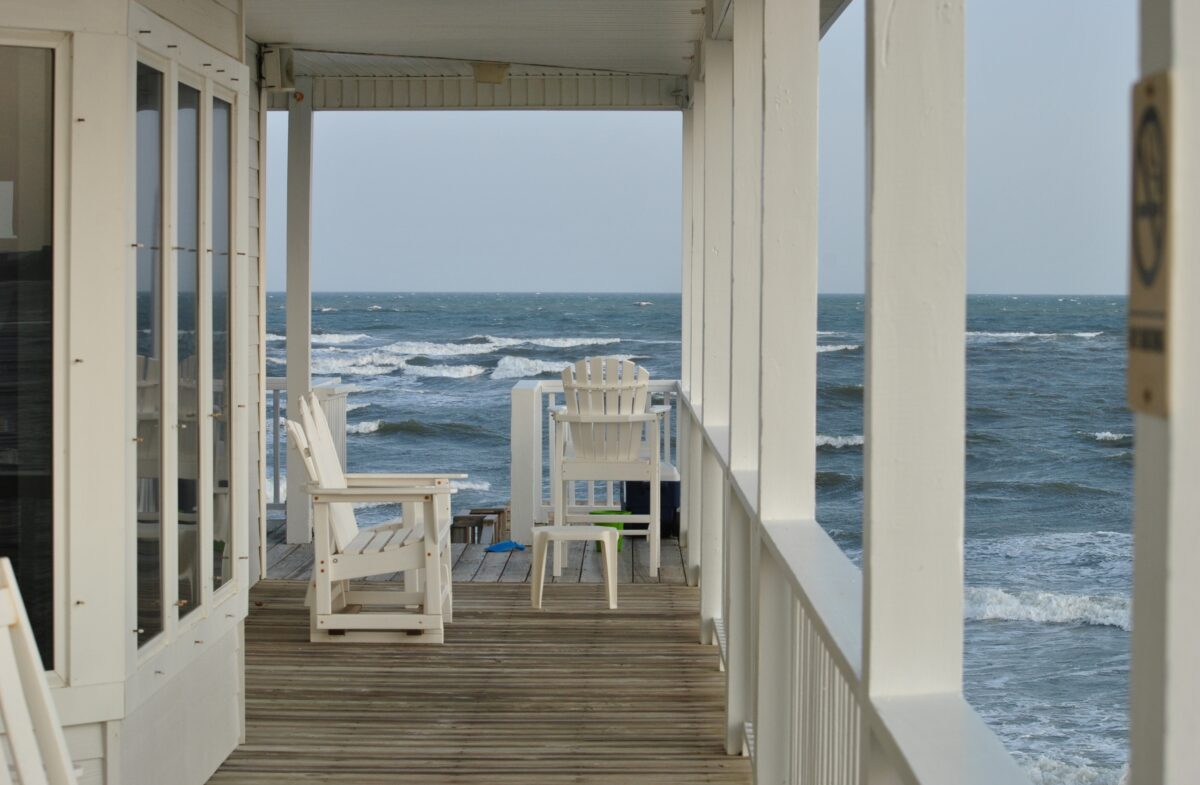
Photo by Alexander Simonsen on Unsplash











 This coming Tuesday night will feature some of LA’s best songwriters! Ted Russell Kamp, Abby Posner, Mary Scholz and me~


