January 2022 showed a different face than we were seeing all last year. Of course, in many respects that’s a good thing. Depending on whether you’re buying or selling, the real estate market for 2022 could be wonderful or horrible. As always, the location will make an even bigger difference.
Sales Volume Dropping
Check out all the red ink in the table below. Compared to December, sales volume is down by nearly 50% at the Beach and on the Hill. November and December of 2021 were heavy with transactions spurred on by the fear of increasing interest rates. The number of homes sold in comparison to January of last year also dropped, though not to as great an extent.

As of right now interest rates are expected to hover in the 3.5% to 4% range for the balance of the year. The increase from under 3% to roughly 3.5% has served to lock a substantial portion of entry level buyers into the rental pool. Those who found a place and could afford to buy last year did. The first part of this year is expected to continue to show declining sales volume as many first time buyers drop out of the purchasing market.
Prices Starting to Reverse Direction
Prices meanwhile are faltering in the unsustainable march upward. As the table above shows, the Beach and the Inland areas have already begun declines in the median price. Simultaneously buyers in the Harbor and Palos Verdes communities have continued pushing purchase prices higher, though not nearly as fast as last year.
We expect price corrections in all four areas as the year rolls out. Initially, we anticipate buyers in the Inland and Harbor areas to balk at the combination of higher interest rates and historically higher prices. Lower priced homes are traditionally impacted sooner and to a greater degree by changes in mortgage interest.
Homes on the Palos Verdes Peninsula and in the Beach communities of the South Bay are expected to also experience price declines as the market adjusts to the new reality of higher prices, steeper interest rates and the shrinking impact of Covid.
The Covid Connection
Covid wreaked havoc with social lives, business practices and just about every other aspect of society. When the pandemic struck in 2020 the real estate world was already heated because of low interest rates. Unfortunately, protecting society from Covid meant slowing down much of the business world, including real estate transactions. For months agents were dealing with masks, alcohol gel and the task of wiping every surface touched by potential buyers. And the buyers kept coming because the interest rates made buying a home affordable for many.
By the time 2021 started, the industry had found ways to show property and ways to consummate paperwork with relative safety from Covid. Keeping one eye on the mortgage interest rate, the buying public responded promptly. It was one of the busiest years ever for brokers and agents. As the year ended and lenders continued raising the cost of purchase loans, buyers started showing signs of stress.
January appears to have been the fulcrum point for a shift in market dynamics. The people involved are more than ready for relief from Covid. Bidding wars have all but ended. Price reductions are coming after only a few weeks on the market. The State has declared Covid “endemic.” Essentially we’re ready for normal business.
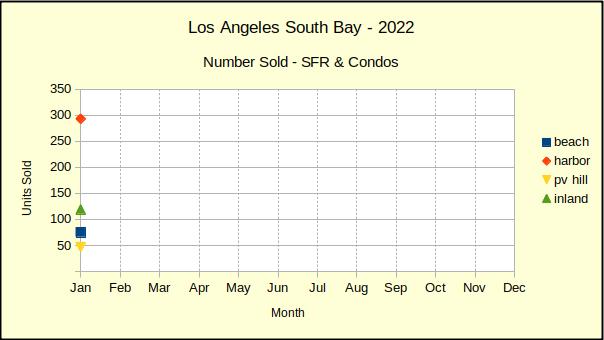
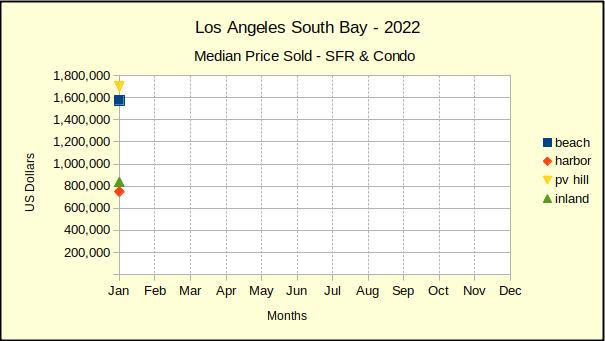
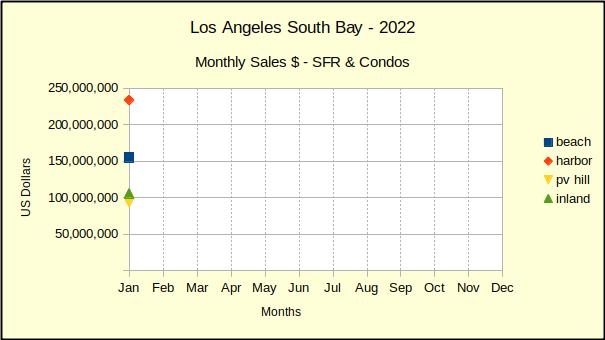
The first month of the year has pointed in the direction of a slowing market, with some pricing shifts to compensate for over-exuberant purchases in the close out of 2021. We anticipate February to show more of the same. We’ll be back soon with charts comparing the monthly progress. (You’ll find the beginning charts for 2022 at the bottom. Not real exciting without data to compare.)
The High Sale and the Low Sale
We’ve had requests for a little “human interest” added to the dry statistics we throw out here every month. We’re going to try to do that while still maintaining privacy for the people involved. Let us know how we’re doing.
For example, an observation we made this past month was the highest sale versus the lowest sale as reported by TheMLS for January. Those of you who follow us know the Beach areas are invariably at the top of the chart, so you won’t be surprised to find that the highest sale in January was in the Manhattan Beach hill section. New in 2021, this expansive 6 bed, 6.5 bath home sold for $6.5M. At nearly 6500 square feet, that’s over $1,000 per sq ft.
It’s far from the highest price we’ve seen there, but that piqued our curiousity. So we looked to the other end and found the lowest January sale in our part of the South Bay. Down from 6500 sq ft to 400 sq ft, and from $6.5M to $255K, this studio condo in Long Beach calculates out to a hair over $600 per sq ft. In other words, about 60% of the cost to build new construction in Manhattan Beach.
2022 Charts – The Beginning Point
The first chart of the year is less than exciting. We’ve included them here for reference. In March, when we can compare January to February and we can be confident we are past the bulk of the pandemic, these should be much more interesting and informative.


